📊
🔍 Momentum
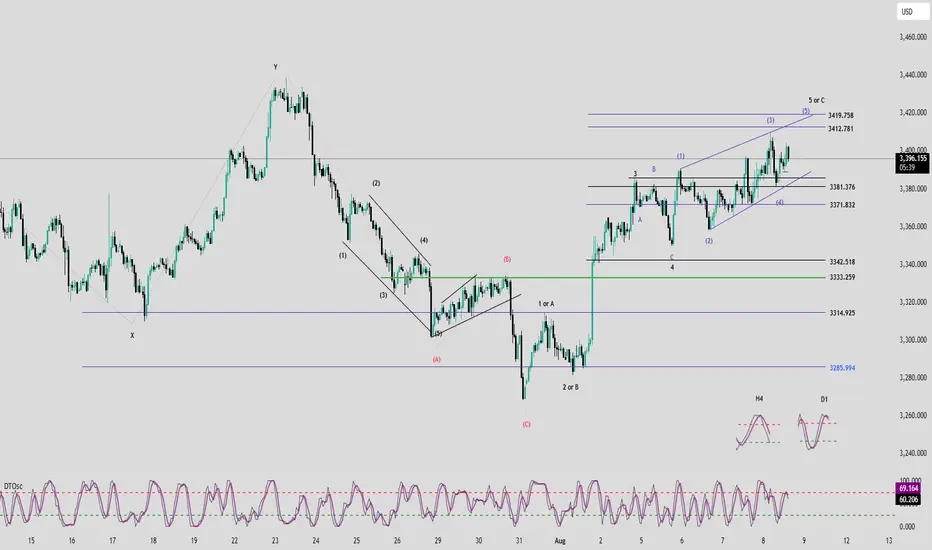
• D1 Timeframe: Daily momentum is currently turning down, limiting the potential for a long-term rally in the current bullish wave. This also suggests that the top may already have formed around the 3,409 level.
• H4 Timeframe: Momentum is still declining and needs about one more H4 candle to reverse upward. For now, the downward move is likely to continue, so caution is advised.
• H1 Timeframe: Showing early signs of a short-term bearish reversal. This decline is important and will be analyzed further after the wave structure review.
🌀 Wave Structure
The current price action suggests a potential Ending Diagonal formation. Once completed, this pattern is typically followed by a sharp and sudden drop.
So far, no sharp decline has occurred, meaning the ending diagonal may not be finished yet. The ideal completion zones for Wave 5 are around 3412 or 3419.
Ending diagonals tend to develop in a complex manner, so a safer approach is to enter trades after price breaks below the lower boundary of the diagonal.
👉 Additional Scenario: If H1 momentum reverses downward and price breaks below 3381, it is likely to drop toward 3371. This area could be considered for a Buy setup.
Conversely, if price does not break below 3381 and instead rises toward 3412, it may indicate that Wave 5 is completing at that level.
📈 Trading Plan
• SELL Zone 1: 3412 – 3414
o SL: 3417
o TP1: 3393
o TP2: 3372
• SELL Zone 2: 3419 – 3421
o SL: 3429
o TP1: 3395
o TP2: 3372
🔍 Momentum
• D1 Timeframe: Daily momentum is currently turning down, limiting the potential for a long-term rally in the current bullish wave. This also suggests that the top may already have formed around the 3,409 level.
• H4 Timeframe: Momentum is still declining and needs about one more H4 candle to reverse upward. For now, the downward move is likely to continue, so caution is advised.
• H1 Timeframe: Showing early signs of a short-term bearish reversal. This decline is important and will be analyzed further after the wave structure review.
🌀 Wave Structure
The current price action suggests a potential Ending Diagonal formation. Once completed, this pattern is typically followed by a sharp and sudden drop.
So far, no sharp decline has occurred, meaning the ending diagonal may not be finished yet. The ideal completion zones for Wave 5 are around 3412 or 3419.
Ending diagonals tend to develop in a complex manner, so a safer approach is to enter trades after price breaks below the lower boundary of the diagonal.
👉 Additional Scenario: If H1 momentum reverses downward and price breaks below 3381, it is likely to drop toward 3371. This area could be considered for a Buy setup.
Conversely, if price does not break below 3381 and instead rises toward 3412, it may indicate that Wave 5 is completing at that level.
📈 Trading Plan
• SELL Zone 1: 3412 – 3414
o SL: 3417
o TP1: 3393
o TP2: 3372
• SELL Zone 2: 3419 – 3421
o SL: 3429
o TP1: 3395
o TP2: 3372
👉 Join the channel to receive more scalping signals!
Channel Telegram: t.me/+XkFQ95yHVOEwNDc1
Channel Telegram: t.me/+XkFQ95yHVOEwNDc1
Related publications
Disclaimer
The information and publications are not meant to be, and do not constitute, financial, investment, trading, or other types of advice or recommendations supplied or endorsed by TradingView. Read more in the Terms of Use.