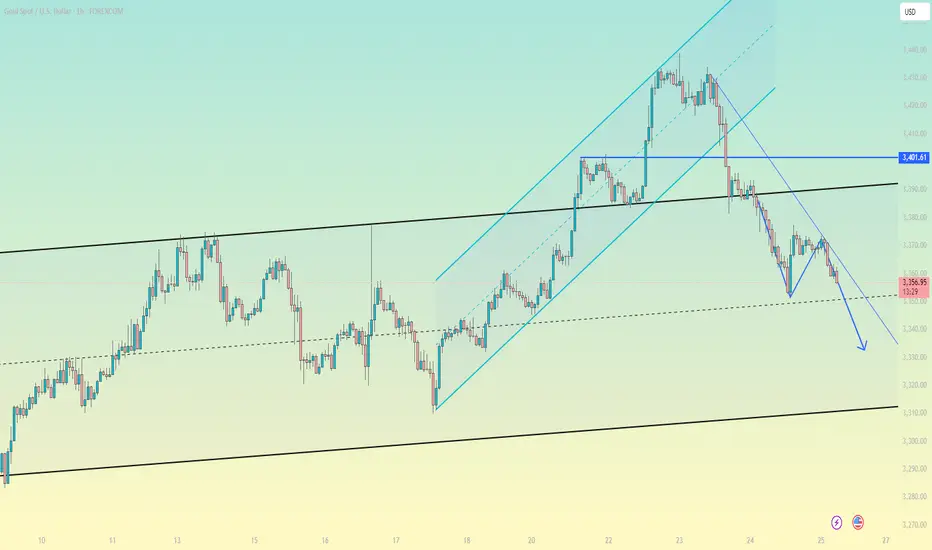
Gold is under pressure, shorts aim at 3310
Gold technical analysis and trading strategy: key support faces test, weak rebound, beware of breakout risk
Fundamental driving factors
The stabilization of the US dollar index suppresses gold prices: recent US economic data (such as retail sales, initial jobless claims) show resilience, the market's expectations for the Fed's rate cuts have been postponed, and US Treasury yields have rebounded, weakening the attractiveness of interest-free assets such as gold.
Risk aversion cools down: The situation in the Middle East has not escalated yet, and the rebound in US stocks has weakened the safe-haven demand for gold.
Fund flow: ETF holdings data show that institutional investors have continued to reduce their holdings of gold recently, reflecting that market sentiment is cautious.
Key technical signals
1. 4-hour cycle: oscillating bearish structure
Clear suppression: The overnight rebound high of 3375 (38.2% Fibonacci retracement level) constitutes a short-term strong and weak boundary, and the price has failed to stand firm here, indicating that bullish momentum is insufficient.
Support overlap: The 3340-35 area is the resonance area of the 4-hour trend line support and the Fibonacci downward target (3335-40). If it is lost, the downward space will be opened to 3320-3300.
Indicator divergence: The MACD histogram is shrinking and the fast and slow lines are close to the zero axis, and the RSI is hovering below 50, suggesting that the rebound momentum is exhausted.
2. 1-hour cycle: short-term technical structure is formed
Descending channel: Thursday's high of 3395 and the current high of 3377 form a secondary high point. Connecting the low point of the hourly chart can draw a descending channel, and the price runs along the lower track of the channel.
Key watershed: 3350 (61.8% retracement level) is a short-term long and short battle point. After breaking it, it will accelerate the test of 3340-35.
Today's trading strategy
Direction: Rebound high and empty mainly, and follow up after breaking the support.
Entry:
Aggressive short order: 3368-3373 light position short test, stop loss above 3380, target 3345-3340.
Steady short order: If the price rebounds to 3375-3380 under pressure, add short position, stop loss 3385, target unchanged.
Take profit and risk control:
Partial reduction of position near the first target 3340, the remaining position observes the support strength of 3340-35.
If it quickly breaks below 3340, short can be chased to 3325-3320 (previous low of daily line).
Alternative plan:
If the price unexpectedly breaks through 3380 and stabilizes, short position needs to be exited, wait and see the 3390-3400 pressure zone and then choose the opportunity to layout.
Key Tips
Don’t blindly buy the bottom: The current technical structure has not shown a bottom signal. Although the 3340-35 area is support, if it is accompanied by a large negative line break, it may trigger long stop-loss orders.
Data risk: Pay attention to the US PMI data in the evening. If it is stronger than expected, it may strengthen the dollar to suppress gold prices.
Free Signals:t.me/+CXftl_-QHEo2Yzc0
Disclaimer
The information and publications are not meant to be, and do not constitute, financial, investment, trading, or other types of advice or recommendations supplied or endorsed by TradingView. Read more in the Terms of Use.
Free Signals:t.me/+CXftl_-QHEo2Yzc0
Disclaimer
The information and publications are not meant to be, and do not constitute, financial, investment, trading, or other types of advice or recommendations supplied or endorsed by TradingView. Read more in the Terms of Use.