Hello traders,
When extreme positions meet historical-level events: The logic of gold in the week before Valentine's Day 2025!
When banks are shorting gold at record levels, but long queues form at Asian gold shops; when COMEX inventory figures soar, yet physical delivery becomes exceptionally difficult; when the Federal Reserve sounds hawkish, but the market bets on interest rate cuts—these three fundamental contradictions constitute the core logic of gold's movement this week. During the week of February 10, all complex indicators will be subjected to the most primal law of supply and demand: Trump's tariffs impact manufacturing, Powell's testimony shakes interest rate expectations, and CPI data resets market rhythms. The international gold price's hovering around $2,900 per ounce essentially represents the ultimate showdown between physical scarcity and futures manipulation.
Currently, the gold trading market shows structural abnormal signals.
1. Extreme Position Divergence: Swap dealers' net short positions in gold reached -264,731 contracts (the highest recorded since COMEX began), while managed funds' long positions surged by 28% quarter-on-quarter.
The net short position of swap dealers at -264,731 contracts corresponds to a physical quantity of: 100 ounces per contract → Total short position = 26,473,100 ounces ≈ 823 tons → Exceeding the People's Bank of China's entire net increase for 2024 (785 tons) → Equivalent to 66 days of global gold mine output!
This is an epic bet between the banking system and speculative capital!
The 28% increase in managed funds' long positions: Managed funds' long positions rose from 189,621 to 242,714 contracts → In just two weeks, they accumulated approximately **$16 billion** worth of gold contracts - **Leverage Ratio**: Based on an 8% margin calculated by CME → Effectively controlling a nominal position of $200 billion → Exceeding South Africa's entire GDP for the year (1.9 trillion rand ≈ $100 billion).
2. Physical Liquidity Crisis: According to the London Bullion Market Association, January's gold lending rate surged to an annualized 5.3% (10-year average 0.8%), with borrowing costs skyrocketing: The annual interest on borrowing 1 ton of gold increased from $80,000 to $530,000, comparable to loan shark rates (indicating extreme physical scarcity).
3. Delivery Inventory Anomalies: COMEX registered warehouse receipts surged by 40 Moz in one week (60% of global monthly output), but 99% came from JPMorgan's London vault transfer, with actual available inventory increasing by only 0.3 Moz.
Current most dangerous signal chain deduction:
Trigger Path: Trump's tariff increases → Chinese exporters dump U.S. debt to buy gold → London vaults accelerate depletion → COMEX shorts forced to buy back physical → Price difference exceeds $200 → Exchanges modify delivery rules.
Historical References: 1. The night before negative oil prices in April 2020: Swap dealers' net short positions in oil reached historical peaks; 2. Before the 2008 Lehman crisis: Gold swap dealers' net short positions were only 1/3 of the current level!
Here’s an explanation:
1. What does it mean for the price difference to exceed $200?
The "price difference" here specifically refers to the premium difference between the Shanghai Gold Exchange (SGE) spot gold price and the London LBMA spot gold price.
Currently, this price difference has exceeded $120 per ounce (historical normal range is ±$5). If it continues to expand to $200, it means:
- Physical liquidity crisis: Chinese importers are willing to pay exorbitant shipping/insurance costs to obtain gold.
- Currency signal: Indicates extreme demand from holders of RMB assets to hedge against dollar risks.
- Arbitrage black hole: Theoretically, there exists a risk-free profit of $120 per ounce, but actual barriers exist due to foreign exchange controls.
This is like bottled water in the desert, normally priced at $2 per bottle, but if the oasis suddenly dries up, those trapped might be willing to pay $200—indicating that the price difference reveals survival demand rather than reasonable pricing.
2. The main risk point for exchanges modifying delivery rules lies in COMEX (New York Mercantile Exchange), and possible rule adjustments could include:
- Increasing delivery margin: For example, raising it from the current 8% of contract value to 15%.
- Restricting short positions: Mandating that some short positions hold physical gold certificates.
- Introducing regional premium coefficients: Recognizing the Shanghai gold premium as a component of reasonable pricing.
Historical reference: In 2022, when a similar situation occurred with LME nickel futures, the exchange directly canceled the daily settlement price, leading to a collapse of market trust. If COMEX is forced to modify rules, it could trigger a more severe pricing crisis in derivatives.
Recently, a similar case occurred, such as the March 2023 London vault incident. When available inventory in London dropped to a historical low, COMEX suddenly allowed the use of Canadian Maple Leaf coins instead of standard gold bars for delivery, resulting in:
- Arbitrageurs frantically purchasing Canadian coins → The premium for Maple Leaf coins surged by 400% in a week;
- Interbank gold lending rates soared to 8.5%;
- Ultimately forcing LBMA to recognize 1-kilogram gold bars as the new delivery standard.
Key event timeline for this week:
| Date | Event | Market Impact Level |
|------------|--------------------------------------------|---------------------|
| February 10 (Monday) | Trump's "reciprocal tariffs" list announced | ★★★★☆ |
| February 11 (Tuesday) | Powell's semi-annual monetary policy hearing | ★★★★★ |
| February 12 (Wednesday) | U.S. January CPI (expected 3.1% / core 4.0%) | ★★★★★ |
| February 13 (Thursday) | U.S. January PPI | ★★★☆☆ |
**Gold**
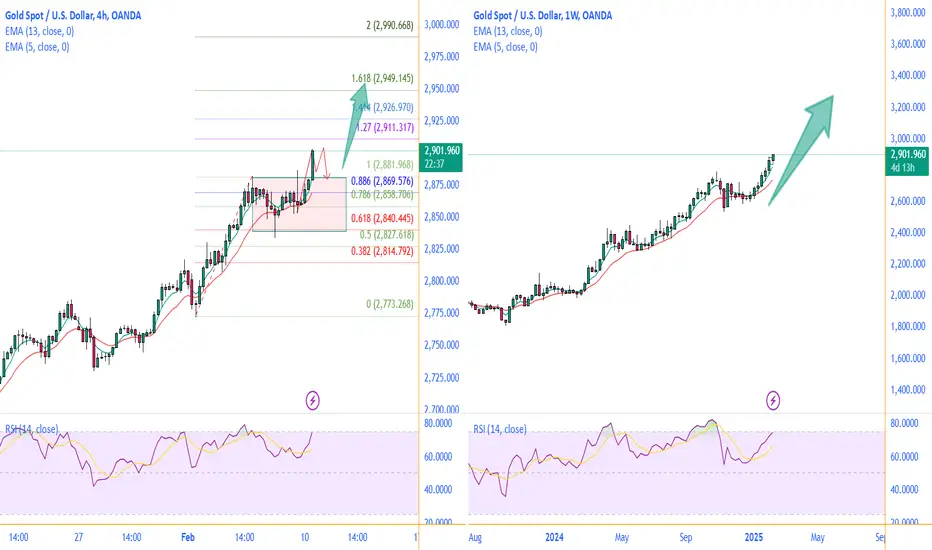
On the non-farm trading day last Friday, two long entry plans for gold suggested within the circle both pointed to:
The medium-term target for gold is:
TP1: 2880, previous high
TP2: 2911, FIBO EXT 1.27 position.
The first target has been reached, waiting for the second target to arrive!
Currently, gold is in a resonance state between the four-hour chart and the daily chart. After the Asian market opens on Monday, gold experienced a jump, and the upward trend continued into the European morning session, with prices still rising.
On the one-hour chart, all K-lines are running above the EMA, so it is not suitable to establish new positions.
Wait for a new consolidation pattern to appear on the one-hour chart before considering entry.
When extreme positions meet historical-level events: The logic of gold in the week before Valentine's Day 2025!
When banks are shorting gold at record levels, but long queues form at Asian gold shops; when COMEX inventory figures soar, yet physical delivery becomes exceptionally difficult; when the Federal Reserve sounds hawkish, but the market bets on interest rate cuts—these three fundamental contradictions constitute the core logic of gold's movement this week. During the week of February 10, all complex indicators will be subjected to the most primal law of supply and demand: Trump's tariffs impact manufacturing, Powell's testimony shakes interest rate expectations, and CPI data resets market rhythms. The international gold price's hovering around $2,900 per ounce essentially represents the ultimate showdown between physical scarcity and futures manipulation.
Currently, the gold trading market shows structural abnormal signals.
1. Extreme Position Divergence: Swap dealers' net short positions in gold reached -264,731 contracts (the highest recorded since COMEX began), while managed funds' long positions surged by 28% quarter-on-quarter.
The net short position of swap dealers at -264,731 contracts corresponds to a physical quantity of: 100 ounces per contract → Total short position = 26,473,100 ounces ≈ 823 tons → Exceeding the People's Bank of China's entire net increase for 2024 (785 tons) → Equivalent to 66 days of global gold mine output!
This is an epic bet between the banking system and speculative capital!
The 28% increase in managed funds' long positions: Managed funds' long positions rose from 189,621 to 242,714 contracts → In just two weeks, they accumulated approximately **$16 billion** worth of gold contracts - **Leverage Ratio**: Based on an 8% margin calculated by CME → Effectively controlling a nominal position of $200 billion → Exceeding South Africa's entire GDP for the year (1.9 trillion rand ≈ $100 billion).
2. Physical Liquidity Crisis: According to the London Bullion Market Association, January's gold lending rate surged to an annualized 5.3% (10-year average 0.8%), with borrowing costs skyrocketing: The annual interest on borrowing 1 ton of gold increased from $80,000 to $530,000, comparable to loan shark rates (indicating extreme physical scarcity).
3. Delivery Inventory Anomalies: COMEX registered warehouse receipts surged by 40 Moz in one week (60% of global monthly output), but 99% came from JPMorgan's London vault transfer, with actual available inventory increasing by only 0.3 Moz.
Current most dangerous signal chain deduction:
Trigger Path: Trump's tariff increases → Chinese exporters dump U.S. debt to buy gold → London vaults accelerate depletion → COMEX shorts forced to buy back physical → Price difference exceeds $200 → Exchanges modify delivery rules.
Historical References: 1. The night before negative oil prices in April 2020: Swap dealers' net short positions in oil reached historical peaks; 2. Before the 2008 Lehman crisis: Gold swap dealers' net short positions were only 1/3 of the current level!
Here’s an explanation:
1. What does it mean for the price difference to exceed $200?
The "price difference" here specifically refers to the premium difference between the Shanghai Gold Exchange (SGE) spot gold price and the London LBMA spot gold price.
Currently, this price difference has exceeded $120 per ounce (historical normal range is ±$5). If it continues to expand to $200, it means:
- Physical liquidity crisis: Chinese importers are willing to pay exorbitant shipping/insurance costs to obtain gold.
- Currency signal: Indicates extreme demand from holders of RMB assets to hedge against dollar risks.
- Arbitrage black hole: Theoretically, there exists a risk-free profit of $120 per ounce, but actual barriers exist due to foreign exchange controls.
This is like bottled water in the desert, normally priced at $2 per bottle, but if the oasis suddenly dries up, those trapped might be willing to pay $200—indicating that the price difference reveals survival demand rather than reasonable pricing.
2. The main risk point for exchanges modifying delivery rules lies in COMEX (New York Mercantile Exchange), and possible rule adjustments could include:
- Increasing delivery margin: For example, raising it from the current 8% of contract value to 15%.
- Restricting short positions: Mandating that some short positions hold physical gold certificates.
- Introducing regional premium coefficients: Recognizing the Shanghai gold premium as a component of reasonable pricing.
Historical reference: In 2022, when a similar situation occurred with LME nickel futures, the exchange directly canceled the daily settlement price, leading to a collapse of market trust. If COMEX is forced to modify rules, it could trigger a more severe pricing crisis in derivatives.
Recently, a similar case occurred, such as the March 2023 London vault incident. When available inventory in London dropped to a historical low, COMEX suddenly allowed the use of Canadian Maple Leaf coins instead of standard gold bars for delivery, resulting in:
- Arbitrageurs frantically purchasing Canadian coins → The premium for Maple Leaf coins surged by 400% in a week;
- Interbank gold lending rates soared to 8.5%;
- Ultimately forcing LBMA to recognize 1-kilogram gold bars as the new delivery standard.
Key event timeline for this week:
| Date | Event | Market Impact Level |
|------------|--------------------------------------------|---------------------|
| February 10 (Monday) | Trump's "reciprocal tariffs" list announced | ★★★★☆ |
| February 11 (Tuesday) | Powell's semi-annual monetary policy hearing | ★★★★★ |
| February 12 (Wednesday) | U.S. January CPI (expected 3.1% / core 4.0%) | ★★★★★ |
| February 13 (Thursday) | U.S. January PPI | ★★★☆☆ |
**Gold**
On the non-farm trading day last Friday, two long entry plans for gold suggested within the circle both pointed to:
The medium-term target for gold is:
TP1: 2880, previous high
TP2: 2911, FIBO EXT 1.27 position.
The first target has been reached, waiting for the second target to arrive!
Currently, gold is in a resonance state between the four-hour chart and the daily chart. After the Asian market opens on Monday, gold experienced a jump, and the upward trend continued into the European morning session, with prices still rising.
On the one-hour chart, all K-lines are running above the EMA, so it is not suitable to establish new positions.
Wait for a new consolidation pattern to appear on the one-hour chart before considering entry.
Trade active
Trade closed: target reached
TP2: 2911, FIBO EXT 1.27 position hit!Join Free Telegram Group to get all the updates: t.me/FuntraderVera
Related publications
Disclaimer
The information and publications are not meant to be, and do not constitute, financial, investment, trading, or other types of advice or recommendations supplied or endorsed by TradingView. Read more in the Terms of Use.
Join Free Telegram Group to get all the updates: t.me/FuntraderVera
Related publications
Disclaimer
The information and publications are not meant to be, and do not constitute, financial, investment, trading, or other types of advice or recommendations supplied or endorsed by TradingView. Read more in the Terms of Use.