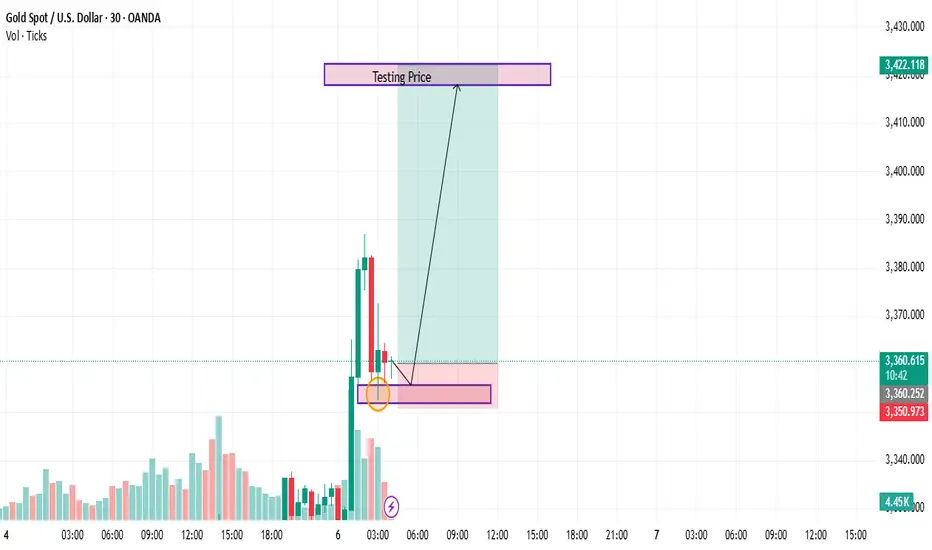
This 30-minute chart of XAU/USD highlights a recent rejection from a clearly defined demand zone, marked in purple. Price briefly dipped into the zone, forming a potential bullish signal (circled in orange), followed by a recovery. The chart outlines a projected move toward the upper testing area near 3,422, suggesting bullish momentum if the zone holds. Volume activity and price structure support the case for an upward retest.
Trade active
*Current Status:***Price:** Hovering around **3,360.510**
*Bullish (short-term)
*Condition:** Pullback into demand completed; confirmation candle forming
*Target Zone:** 3,420–3,425
*Invalidation:** Clean break and close below 3,350
Trade closed: target reached
Current Market Context (XAU/USD – 30m Chart)Current Price Zone: ~3373.44
Highlighted Reaction Area: The price interacted with a previously marked support box and showed a response (possible buyer interest observed).
Testing Price Zone: Price is progressing toward the highlighted top box, marked “Testing Price” (~3422), which could act as a key reaction level.
🔎 Observations
There was a visible price rejection from the lower purple box.
Volume increased at the point of reversal.
Candle structure suggests a short-term upward bias.
Price is still within the range, not yet fully committed to either direction.
Price remains inside the marked range.
Upper zone could be watched for reaction if approached.
Risk management zones (highlighted red box) remain intact
I Will Sharing Personal Entries &How Trades.
All Of These For Free & I Will Not Take a Penny From Anyone .
So Please My Friends Trade On Your Own Risk
If You Guys Like My Ideas Then Follow Me And Comments Me .
All Of These For Free & I Will Not Take a Penny From Anyone .
So Please My Friends Trade On Your Own Risk
If You Guys Like My Ideas Then Follow Me And Comments Me .
Disclaimer
The information and publications are not meant to be, and do not constitute, financial, investment, trading, or other types of advice or recommendations supplied or endorsed by TradingView. Read more in the Terms of Use.