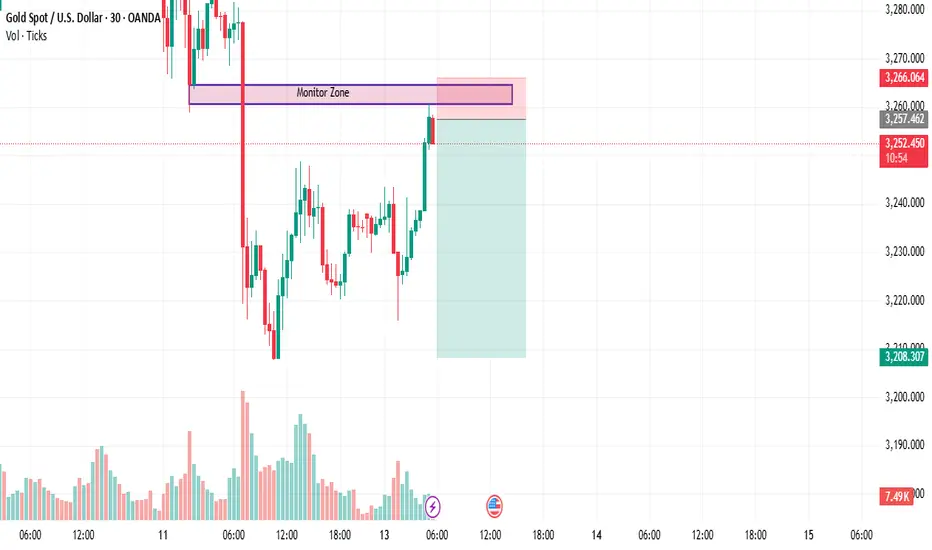
The chart shows the price movement of Gold (XAU/USD) over a 30-minute timeframe. After a significant drop, the price started to recover and moved upwards. The highlighted area marked as the "Monitor Zone" indicates a critical price level where traders are paying close attention to possible reactions. Currently, the price is approaching this zone, suggesting a potential point of resistance or consolidation. Volume levels are increasing, indicating heightened market activity
Trade active
The chart shows a recent upward price movement after a previous decline. The price is approaching a key resistance area labeled as the "Monitor Zone," where increased trading activity is observed. The market sentiment appears cautiously bullish as the price tests this critical level.Trade closed: target reached
Gold has moved significantly after entering the highlighted area, showing a sharp decline of over 400 points. The marked zone represents a key area of interest where the price action was closely monitored. After exiting this zone, the price continued to move downward, reflecting notable market momentum. Observing the volume and candlestick patterns within this area provides insights into market sentiment during this phase."**I Will Sharing Personal Entries &How Trades.
All Of These For Free & I Will Not Take a Penny From Anyone .
So Please My Friends Trade On Your Own Risk
If You Guys Like My Ideas Then Follow Me And Comments Me .
All Of These For Free & I Will Not Take a Penny From Anyone .
So Please My Friends Trade On Your Own Risk
If You Guys Like My Ideas Then Follow Me And Comments Me .
Disclaimer
The information and publications are not meant to be, and do not constitute, financial, investment, trading, or other types of advice or recommendations supplied or endorsed by TradingView. Read more in the Terms of Use.
I Will Sharing Personal Entries &How Trades.
All Of These For Free & I Will Not Take a Penny From Anyone .
So Please My Friends Trade On Your Own Risk
If You Guys Like My Ideas Then Follow Me And Comments Me .
All Of These For Free & I Will Not Take a Penny From Anyone .
So Please My Friends Trade On Your Own Risk
If You Guys Like My Ideas Then Follow Me And Comments Me .
Disclaimer
The information and publications are not meant to be, and do not constitute, financial, investment, trading, or other types of advice or recommendations supplied or endorsed by TradingView. Read more in the Terms of Use.