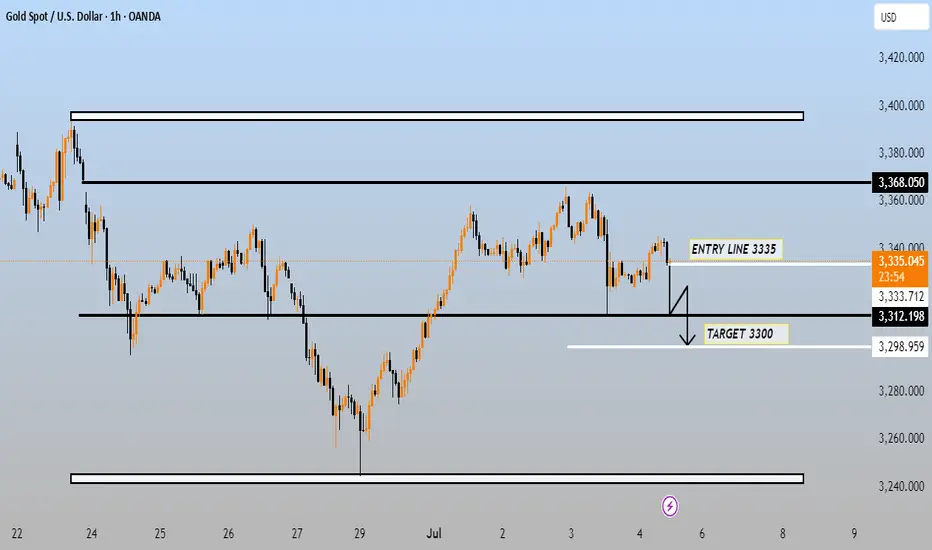
This chart is for Gold Spot (XAU/USD) on the 1-hour timeframe, and it outlines a short trade setup. Here's a breakdown of what it's showing:
🔹 Trade Setup Details:
Entry Line: 3335 USD
This is the proposed level to enter a short position (sell).
Target: 3300 USD
The trade aims for a price drop to this level.
Support Zone: Around 3312–3333 USD
This zone is crucial. If broken, it may confirm the short setup and support a move to the target.
Resistance Level: 3368 USD
A potential invalidation or stop-loss area for the short trade, as breaking this level could signal a bullish reversal.
🧠 Trade Logic:
Bearish Bias: Price is expected to drop if it breaks below the 3335 entry line.
Structure: The price previously failed to break higher and is forming lower highs.
Confirmation: A break and retest of the 3335 line could act as confirmation for the short move.
✅ Summary:
Short entry: ~3335
Target: ~3300
Watch zone: 3333–3312 (key support)
Invalidation level: Above 3368 (if price moves past this resistance, short idea is likely invalid)
Would you like help identifying a stop-loss level or calculating the risk/reward ratio for this trade?
Trade active
TARGET DONEJoin telegram free...
t.me/+16bIVCNBo0MzYzk0
Forex Gold & Crypto Signals with
detailed analysis & get consistent |
result ...
Gold Signals with peoper TP & SL for
high profit ...
t.me/+16bIVCNBo0MzYzk0
t.me/+16bIVCNBo0MzYzk0
Forex Gold & Crypto Signals with
detailed analysis & get consistent |
result ...
Gold Signals with peoper TP & SL for
high profit ...
t.me/+16bIVCNBo0MzYzk0
Disclaimer
The information and publications are not meant to be, and do not constitute, financial, investment, trading, or other types of advice or recommendations supplied or endorsed by TradingView. Read more in the Terms of Use.
Join telegram free...
t.me/+16bIVCNBo0MzYzk0
Forex Gold & Crypto Signals with
detailed analysis & get consistent |
result ...
Gold Signals with peoper TP & SL for
high profit ...
t.me/+16bIVCNBo0MzYzk0
t.me/+16bIVCNBo0MzYzk0
Forex Gold & Crypto Signals with
detailed analysis & get consistent |
result ...
Gold Signals with peoper TP & SL for
high profit ...
t.me/+16bIVCNBo0MzYzk0
Disclaimer
The information and publications are not meant to be, and do not constitute, financial, investment, trading, or other types of advice or recommendations supplied or endorsed by TradingView. Read more in the Terms of Use.