7.17 Gold Market Analysis
Intraday Market and Dominant Factors:
Today, the gold price fluctuated in a narrow range around $3,330/ounce. The overall trend continued to be under pressure, and technically it was constrained by the middle track of the Bollinger Band (currently about $3,344.82), showing a fluctuating and weak pattern.
Analysis of core long and short factors:
Main negatives (suppressing gold prices):
The strong dollar and the hawkish expectations of the Federal Reserve: The strengthening of the US dollar index is the primary pressure facing gold. The market currently generally expects that the Fed's interest rate cut may be postponed until after September, and the easing range may be limited to about 50 basis points this year. The remarks of New York Fed President Williams on "moderately restrictive policies are appropriate" and Dallas Fed President Logan's emphasis on maintaining high interest rates have consolidated this expectation. The resilience of US economic data (especially core CPI and retail sales) further reduced the market's bets on aggressive easing.
Risk appetite remains: The US stock market has maintained high volatility, indicating that the overall market risk appetite has not completely subsided, which has diverted some funds that might have flowed to gold.
Main positives (supporting gold prices):
Policy and geopolitical risks: US President Trump threatened to impose new tariffs on 25 countries including the European Union (effective on August 1), triggering global trade concerns and potential inflationary pressures. At the same time, geopolitical tensions in the Middle East (such as Israel's air strikes on Syria) have escalated, continuing to stimulate the safe-haven demand for gold.
Concerns about the independence of the Federal Reserve: Although Trump denied plans to replace Powell in the short term, the rumors themselves and the potential threat they pose to the independence of the Federal Reserve have become risk factors that cannot be ignored in the market in the medium and long term.
Inflation base and central bank behavior: The stickiness of core inflation and the gold purchasing behavior of global central banks (especially emerging markets) provide a long-term value support basis for gold.
Technical aspects:
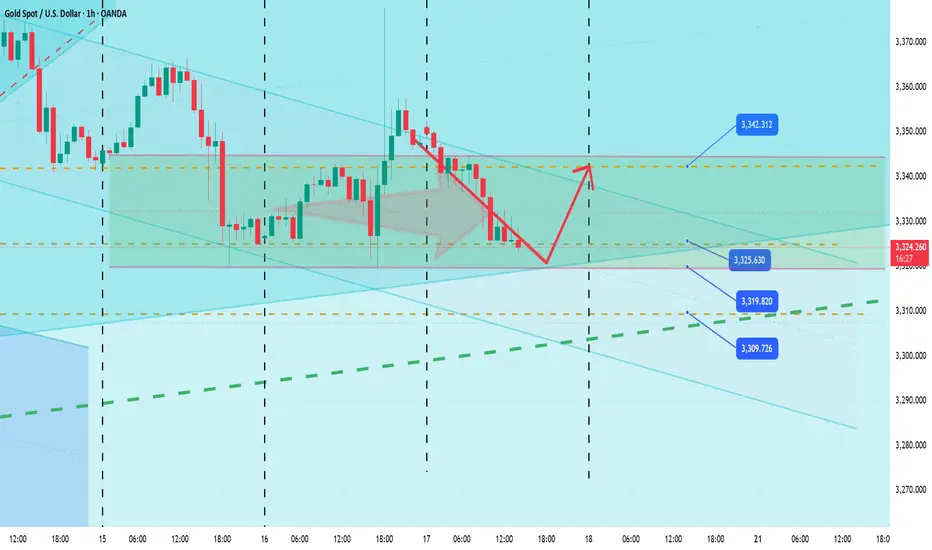
Current form: Gold prices are currently in a clear box-shaped oscillation pattern. The Bollinger Bands are in a closed state, indicating that market volatility is shrinking and entering a consolidation phase.
Key price levels:
Upper resistance: The middle track of the Bollinger Bands at $3344.82 constitutes the primary intraday suppression. More important resistance is located near the psychological level of $3400 and the previous high of $3451. An effective breakthrough of these positions is a necessary signal to start a new round of upward trend.
Support below: The intraday low of $3329 provides initial support. The range of $3320 to $3310 is a key short-term support zone. If this area is lost, the price of gold may accelerate downward to test $3300.
Technical indicators:
MACD: The fast and slow lines maintain a dead cross, and the bar chart is below the zero axis, indicating that the current momentum is still bearish. But it is worth noting that the short momentum bar shows signs of convergence, suggesting that the downward force has weakened and there is a possibility of a weak rebound.
RSI: The current reading is around 49.47, which is in the neutral area but slightly weak, and also points to the lack of a clear direction in the market.
Today's strategy:
Buy: Long with a light position near 3320, and you can add positions if it reaches around 3310. Target near 3340, stop loss 3300.
Sell: Sell near 3340, target 3320, stop loss 3348.
Be cautious in trading and control risks! I wish you a smooth transaction!
Intraday Market and Dominant Factors:
Today, the gold price fluctuated in a narrow range around $3,330/ounce. The overall trend continued to be under pressure, and technically it was constrained by the middle track of the Bollinger Band (currently about $3,344.82), showing a fluctuating and weak pattern.
Analysis of core long and short factors:
Main negatives (suppressing gold prices):
The strong dollar and the hawkish expectations of the Federal Reserve: The strengthening of the US dollar index is the primary pressure facing gold. The market currently generally expects that the Fed's interest rate cut may be postponed until after September, and the easing range may be limited to about 50 basis points this year. The remarks of New York Fed President Williams on "moderately restrictive policies are appropriate" and Dallas Fed President Logan's emphasis on maintaining high interest rates have consolidated this expectation. The resilience of US economic data (especially core CPI and retail sales) further reduced the market's bets on aggressive easing.
Risk appetite remains: The US stock market has maintained high volatility, indicating that the overall market risk appetite has not completely subsided, which has diverted some funds that might have flowed to gold.
Main positives (supporting gold prices):
Policy and geopolitical risks: US President Trump threatened to impose new tariffs on 25 countries including the European Union (effective on August 1), triggering global trade concerns and potential inflationary pressures. At the same time, geopolitical tensions in the Middle East (such as Israel's air strikes on Syria) have escalated, continuing to stimulate the safe-haven demand for gold.
Concerns about the independence of the Federal Reserve: Although Trump denied plans to replace Powell in the short term, the rumors themselves and the potential threat they pose to the independence of the Federal Reserve have become risk factors that cannot be ignored in the market in the medium and long term.
Inflation base and central bank behavior: The stickiness of core inflation and the gold purchasing behavior of global central banks (especially emerging markets) provide a long-term value support basis for gold.
Technical aspects:
Current form: Gold prices are currently in a clear box-shaped oscillation pattern. The Bollinger Bands are in a closed state, indicating that market volatility is shrinking and entering a consolidation phase.
Key price levels:
Upper resistance: The middle track of the Bollinger Bands at $3344.82 constitutes the primary intraday suppression. More important resistance is located near the psychological level of $3400 and the previous high of $3451. An effective breakthrough of these positions is a necessary signal to start a new round of upward trend.
Support below: The intraday low of $3329 provides initial support. The range of $3320 to $3310 is a key short-term support zone. If this area is lost, the price of gold may accelerate downward to test $3300.
Technical indicators:
MACD: The fast and slow lines maintain a dead cross, and the bar chart is below the zero axis, indicating that the current momentum is still bearish. But it is worth noting that the short momentum bar shows signs of convergence, suggesting that the downward force has weakened and there is a possibility of a weak rebound.
RSI: The current reading is around 49.47, which is in the neutral area but slightly weak, and also points to the lack of a clear direction in the market.
Today's strategy:
Buy: Long with a light position near 3320, and you can add positions if it reaches around 3310. Target near 3340, stop loss 3300.
Sell: Sell near 3340, target 3320, stop loss 3348.
Be cautious in trading and control risks! I wish you a smooth transaction!
❤️I am a trading researcher focusing on the gold field.
❤️If you are looking for direction, welcome to follow me.
👉t.me/+CW0VWaiEB59hMmJh
❤️If you are looking for direction, welcome to follow me.
👉t.me/+CW0VWaiEB59hMmJh
Disclaimer
The information and publications are not meant to be, and do not constitute, financial, investment, trading, or other types of advice or recommendations supplied or endorsed by TradingView. Read more in the Terms of Use.