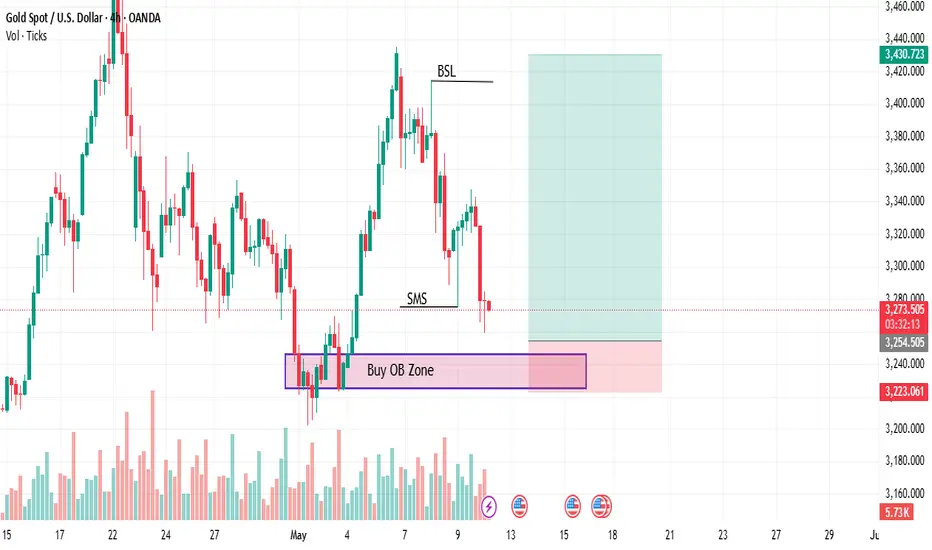
1. **Buy OB Zone:** This highlighted purple rectangular area marks a potential demand zone where buying interest is anticipated. It indicates that the market might experience bullish momentum if the price enters this zone.
2. **SMS (Sign of Market Structure):** This label marks a potential shift in the market structure, indicating a possible change in trend direction or consolidation.
3. **BSL (Buy Side Liquidity):** This label identifies a level where buy-side liquidity may reside, often where previous highs were taken out, indicating possible stop hunts or liquidity grabs.
4. **Price Movement:** The chart shows a recent drop towards the Buy OB Zone after failing to sustain the previous upward movement that formed the BSL.
5. **Risk-to-Reward Zone:** The green area above the entry point indicates the target or profit-taking zone, while the red area below marks the potential risk or stop area.
6. **Volume:** The volume bars at the bottom suggest varying trading activity, which could indicate the strength or weakness of the moves.
This setup likely represents a strategy where the trader expects a bullish reaction from the Buy OB Zone, with a target near the green zone and a stop near the red zone.
Trade active
potential bullish reversal setup based on Smart Money Concepts (SMC). Here’s the current status breakdown:1. Price Action:
The price is approaching the Buy OB Zone (Order Block), suggesting a possible bullish reaction if this demand zone holds.
The recent decline shows a retracement into the OB Zone, which could signal the end of a liquidity grab.
2. Market Structure:
The presence of SMS (Sign of Market Structure) indicates a potential shift from bearish to bullish.
The BSL (Buy Side Liquidity) mark shows that previous highs have been targeted, which could mean liquidity has been collected for a bullish move.
3. Risk and Reward:
The green zone above indicates the take-profit target, while the red zone below marks the stop-loss area.
The risk-to-reward (RR) ratio appears favorable if the setup plays out as expected.
4. Volume Analysis:
There is an increase in volume around the OB Zone, indicating potential buying interest.
5. Current Sentiment:
Neutral to Bullish: If the price holds within or slightly above the OB Zone, a bullish reaction is likely.
Bearish Confirmation: A strong breakdown below the OB Zone would indicate further downside.
I Will Sharing Personal Entries &How Trades.
All Of These For Free & I Will Not Take a Penny From Anyone .
So Please My Friends Trade On Your Own Risk
If You Guys Like My Ideas Then Follow Me And Comments Me .
All Of These For Free & I Will Not Take a Penny From Anyone .
So Please My Friends Trade On Your Own Risk
If You Guys Like My Ideas Then Follow Me And Comments Me .
Disclaimer
The information and publications are not meant to be, and do not constitute, financial, investment, trading, or other types of advice or recommendations supplied or endorsed by TradingView. Read more in the Terms of Use.