
This took a lot of headache to figure out, but I finally did it. And here's what I see:
`
1) we top this October, gold at 6200
2) silver, I could care less until it surpasses gold meaningfully
3) and I still don't see it this year
4) silver's 45-year line is UNDER $51, I do not see this breaking
5) despite gold moving agressively to 6200
6) that is what the math says convincingly
7) this is not the the top for metals
8) but because of the 6X move since beginning of 2016 circa 1000
9) there's going to be a hard retrace that could take a year
10) I don't see silver making waves until well into 2027
11) in chart above, the setup for 6200 requires gold to hit 3850
12) this by first week of July
13) tomorrow is FOMC, we should be above 3500 the day after that
14) obviously this is giant move in a very tight window
15) we will see what I can for semi continuous coverage
Note
Note
06/18/25, 12.5 hours ahead of FOMC, 12:28 AM ET, New York time and I posted this chart in last post: a) in chart above, I use arcs and curves to illustrate what trend maps are saying
b) that is to say there has to be a mountain of technical evidence behind this type of analysiis
c) with that said, a picture is worth a thousand words, for example:
Note
Note
d) in the most basic read of chart abovee) this rally, from end of 2015 or beginning of 2016 when price was about $1050
f) is comparable about 2.91 time frame wise vs 1976 through 1980 time frame when price ...
g) went 100 to 875 or 8.75x
h) so if we DISREGARD THE PATTERN DIFFERENCE, when price goes vertical ...
i) which it is about to do in the 125 days ahead
j) and runs into the the arc curving backwards, that's the top
k) in other words 6200 about October 17-21 this year
l) where the difference in pattern matter is that this time is NOT THE TOP
Note
m) and why? n) because the right side of chart above is deceiving...
o) meaning it doesn't need that curve for 6200
p) WE ONLY NEED THIS ONE:
Note
Note
q) in chart above, that's the black curve and here is zoomed in: Note
Note
Note
Note
Note
9:01 AM, looks like more stalling today.1) don't know if it will move yet
2) not saying it can't
3) but first impression says more stalling
Note
4) 9:09 AM, it keeps saying almost ready Note
Note
10:00 AM ET, chart above is full count since 16101) with two more counts remaining
2) meaning approximately 12500 and 25000
Note
3) but this would take several more yearsNote
4) but it all makes sense like this:Note
5) in chart above, where 6200 is blue 3 6) hence the explanation why silver hasn't moved
7) despite that 700 target I wrote about ago
8) because it's still early
9) even gold at 6200, would likely correct 5200, 4800 maybe even lower
10) it's at this correction after 6200, which would take place by this December if early...
11) and by next August if late...
12) that we confirm the point I made a while ago
13) that silver weakness WEAKENS vs gold weakness
14) that is to say we would see silver CORRECT LESS IN % TERMS THAN GOLD
15) then the silver market boom would finally start
Note
Note
Note
16) in chart above that would mean that the FOMC meeting today will disappoint17) so what can cause the reverse up?
18) REAL WAR, maybe the U.S. gets in
19) maybe something else
20) in any case, 3650 for JUNE 24TH stays as the target
Note
Note
10:20 PM 6.19, this is taking way too long to break out...Note
10:20 AM, 6.20, 3368 after passing 3333 test and...1) this is not going to work
2) I cannot make sense of all of it together
3) too many conflicting signals in gold, silver, trend and fundamentals
4) so I the first obvious understanding is this move cannot happen
5) what will happen?
6) no idea, but it doesn't look great because the setup is gone
7) there's only one move left to entertain and right now not worth entertaining
8) the end
Note
Sunday 12:14 AM ET, 6/21...1) I am aware Trump bombed Iran
2) and in a big way... is it enough?
3) in a word, no it's not
4) even if price some how made it to 3850-40xx
5) this move is over
6) we need an 15-20% correction
7) before the rally to what looks like 6200-6400
8) and this would push that 6K top into Jan of 2027
9) so in the mean time?
10) no doubt this bombing results in 3400 again
11) beyond that is still much in doubt
12) and if no new high soon?
13) that means 2870 before 6200_6400
Note
14) when do I expect 2870 if top is in?15) September or October
16) if some how we get one more high?
17) then November
18) but my attention would turn to China-Taiwan
19) as the cause for 6200 gold prices
20) and for silver?
21) 135 cap if 125 breaks
22) all this by Jan 2027
23) but I expect nothing interesting until
24) 09/20 to 11/20 window
25) I will see you then
Note
Note
1) in chart above, this would make everything make sense2) because we still don't have an obvious top
3) in this case, it would not get interesting until April 2026
Note
6/24, 2:54 PM ET, New York time here's basically how this problem gets solved1) there are 3 scenarios that are worth talking about
2) the first one is chart above in black
3) it requires that this curve will hold:
Note
Note
Note
4) the binary for that move above, which moves for 6200-6400...5) starts out faking to 2870, but finishes the same way, like this:
Note
6) BUT THE SITUATION NOW IS CRITICAL: Note
Note
1) so here is post for that: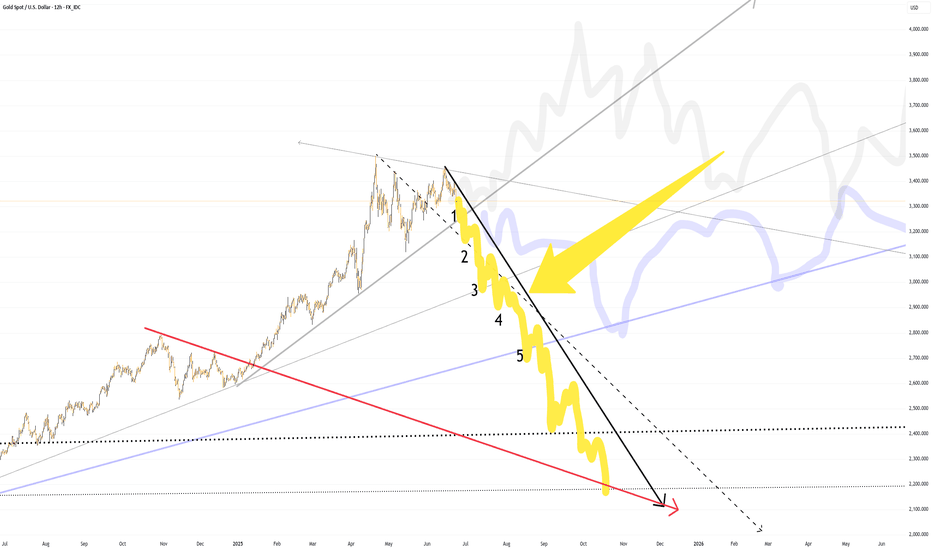
Note
2) again, once price moves under #23) which is 3075...
4) is when it gets interesting
Related publications
Disclaimer
The information and publications are not meant to be, and do not constitute, financial, investment, trading, or other types of advice or recommendations supplied or endorsed by TradingView. Read more in the Terms of Use.
Related publications
Disclaimer
The information and publications are not meant to be, and do not constitute, financial, investment, trading, or other types of advice or recommendations supplied or endorsed by TradingView. Read more in the Terms of Use.