7.24 Gold Market Analysis
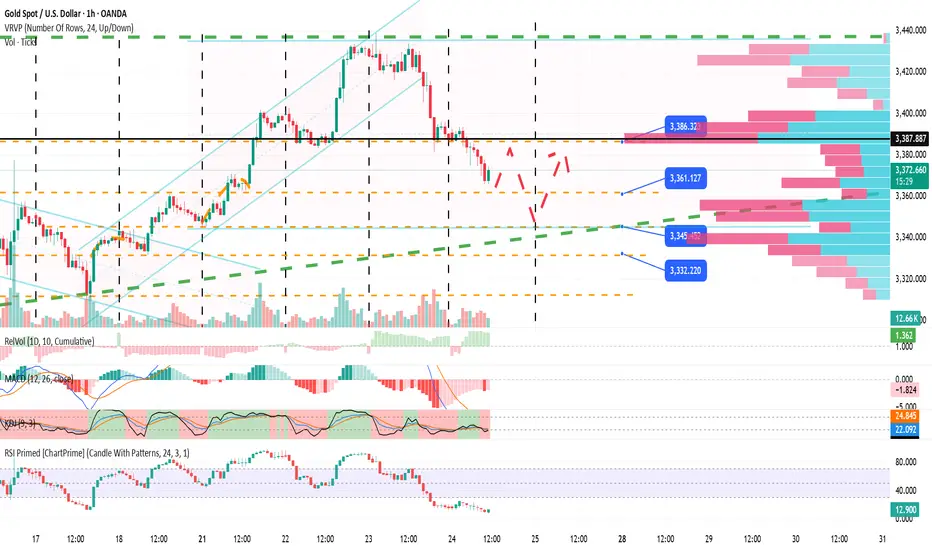
Currently, gold has fallen back after rising, plummeting by $44.50 in a single day, a drop of 1.30%. The daily K-line of gold price closed with a long negative line and completely swallowed up the previous day's gains, indicating that the short-term attempt to challenge the high of $3,450 failed. Intraday, the gold price fell below the key psychological barrier of $3,400, and the lowest touched around $3,373, reflecting a sharp weakening of market sentiment.
Core driving factors
1. Ebb in safe-haven demand:
The conclusion of the US-Japan trade agreement has significantly eased geopolitical tensions and weakened the safe-haven appeal of gold.
The market focus has shifted to the end of the suspension period of the US "reciprocal tariffs" on August 1. Uncertainty remains, but the short-term impact has weakened.
2. Game of long and short forces:
The expectation of two interest rate cuts by the Federal Reserve this year constitutes potential support, and the continued weakness of the US dollar (falling to 97.15) limits the downward space of gold prices.
However, the rising U.S. Treasury yields (10-year bonds rose to 4.384%) pushed up the opportunity cost of holding gold and suppressed bullish momentum.
Technical pattern analysis
1. Key pattern signals:
Repeated battles for $3,400: Gold prices failed to hit $3,400 three times (in May, June and this time), and this level has become a watershed between longs and shorts. We need to be alert to the risk of further correction before it is recovered.
Triangle consolidation continues: The medium-term triangle oscillation structure is currently maintained, and $3,340 (the middle track of the Bollinger band) is the core support below. If it is lost, the medium-term uptrend will be threatened.
2. Short-term trading range:
The upper side is suppressed by $3,410 (the upper track of the Bollinger band) and the integer level of 3,400, and the lower side is supported by $3,365 (the 10-day moving average). It is expected to fluctuate in the range of $3,365-3,410 during the day.
3. Momentum indicator warning:
Daily MACD dead cross formed, RSI fell below the 50 neutral zone, and the short-selling force dominated. If it effectively fell below $3,370 (50-day moving average), it may accelerate to $3,340.
Operation suggestions:
Aggressive strategy: light position near $3,370 to try more, strictly stop loss below $3,350, and temporarily target the $3,400 counter-pressure level.
Steady strategy: wait and see the result of the $3,400 battle. If it is confirmed to fall below the $3,370 support, you can short and look at $3,340.
Medium-term layout: pay attention to the tariff deadline on August 1 and the trend of the Federal Reserve’s July meeting. Consider medium-term long orders after the $3,340 area stabilizes.
Be cautious in trading and control risks! I wish you a smooth transaction!
Disclaimer
The information and publications are not meant to be, and do not constitute, financial, investment, trading, or other types of advice or recommendations supplied or endorsed by TradingView. Read more in the Terms of Use.
Disclaimer
The information and publications are not meant to be, and do not constitute, financial, investment, trading, or other types of advice or recommendations supplied or endorsed by TradingView. Read more in the Terms of Use.