📍 Zones on XAU/USD (1H Timeframe)
---
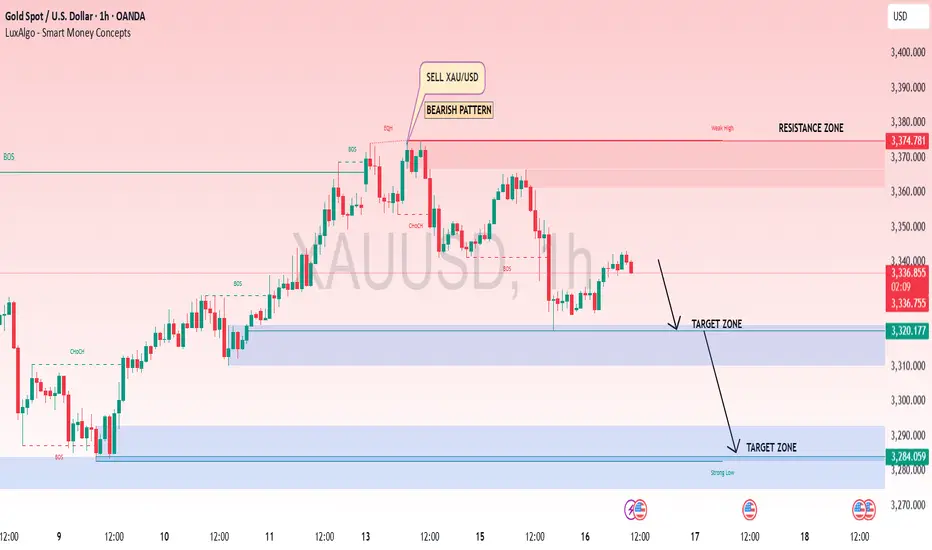
🟥 Resistance Zone (Sell Area):
Zone Range:
3,370.000 – 3,374.781
Purpose:
This is the supply/resistance area where sellers are strong.
Price has rejected this zone — ideal for SELL setups.
---
🎯 Target Zone 1 (First Support):
Zone Range:
3,320.000 – 3,325.000 (approx.)
(Exact from chart: 3,320.171)
Purpose:
First support zone — price may react or bounce here.
Good for partial profit-taking if short.
---
🎯 Target Zone 2 (Second Support):
Zone Range:
3,280.000 – 3,285.000
(Exact from chart: 3,284.059)
Purpose:
Stronger demand zone. Final target area for shorts.
High chance of reversal or consolidation.
---
✅ Summary for Trade Setup
Zone Type Price Range Action
Resistance Zone 3,370 – 3,374.781 Sell below
Target Zone 1 3,320 – 3,325 First Take Profit
Target Zone 2 3,280 – 3,285 Final Take Profit
---
Let me know if you'd like a fresh drawn chart with these zones marked clearly!
---
🟥 Resistance Zone (Sell Area):
Zone Range:
3,370.000 – 3,374.781
Purpose:
This is the supply/resistance area where sellers are strong.
Price has rejected this zone — ideal for SELL setups.
---
🎯 Target Zone 1 (First Support):
Zone Range:
3,320.000 – 3,325.000 (approx.)
(Exact from chart: 3,320.171)
Purpose:
First support zone — price may react or bounce here.
Good for partial profit-taking if short.
---
🎯 Target Zone 2 (Second Support):
Zone Range:
3,280.000 – 3,285.000
(Exact from chart: 3,284.059)
Purpose:
Stronger demand zone. Final target area for shorts.
High chance of reversal or consolidation.
---
✅ Summary for Trade Setup
Zone Type Price Range Action
Resistance Zone 3,370 – 3,374.781 Sell below
Target Zone 1 3,320 – 3,325 First Take Profit
Target Zone 2 3,280 – 3,285 Final Take Profit
---
Let me know if you'd like a fresh drawn chart with these zones marked clearly!
Trade active
Still trade activatedTrade closed: target reached
Congratulations First Target Done trade on from Resistance area 3374 to 3309 market hit 650+pips down📢 Join On Telegram For Best Signals
t.me/+TDB1omSq6K1lYmM0
t.me/+TDB1omSq6K1lYmM0
t.me/+TDB1omSq6K1lYmM0
t.me/+TDB1omSq6K1lYmM0
t.me/+TDB1omSq6K1lYmM0
t.me/+TDB1omSq6K1lYmM0
Disclaimer
The information and publications are not meant to be, and do not constitute, financial, investment, trading, or other types of advice or recommendations supplied or endorsed by TradingView. Read more in the Terms of Use.
📢 Join On Telegram For Best Signals
t.me/+TDB1omSq6K1lYmM0
t.me/+TDB1omSq6K1lYmM0
t.me/+TDB1omSq6K1lYmM0
t.me/+TDB1omSq6K1lYmM0
t.me/+TDB1omSq6K1lYmM0
t.me/+TDB1omSq6K1lYmM0
Disclaimer
The information and publications are not meant to be, and do not constitute, financial, investment, trading, or other types of advice or recommendations supplied or endorsed by TradingView. Read more in the Terms of Use.