🧠 Chart Breakdown & Trade Idea: Symmetrical Triangle Formation
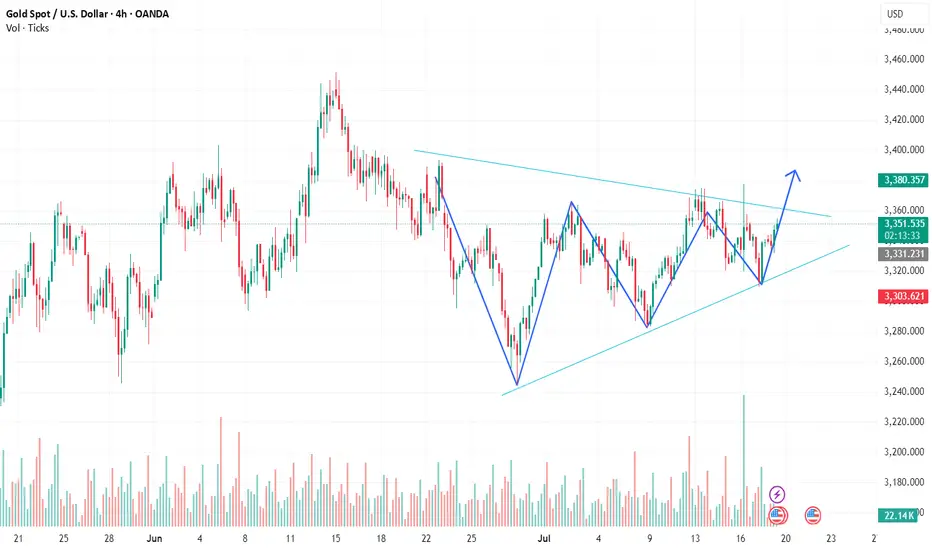
We’re observing a symmetrical triangle formation — a classic consolidation pattern that often precedes a strong breakout move. The price has been making higher lows and lower highs, gradually tightening within two converging trendlines.
This pattern indicates that buyers and sellers are in a temporary equilibrium, with volatility compressing. The market is clearly waiting for a catalyst to decide the next big move.
🔍 Key Observations:
1. Trendlines:
- The upper resistance trendline is sloping downward, connecting several lower highs.
- The lower support trendline is sloping upward, connecting multiple higher lows.
2. Volume Pattern:
- Volume has been tapering off during the consolidation phase — a typical behavior during triangle formation.
- A volume spike at the breakout point would confirm the direction and strength of the move.
3. Price Action:
- The price has bounced cleanly off the lower trendline and is now approaching the upper boundary.
- A strong V-shaped recovery from support indicates buyer dominance at lower levels.
- The market is now testing the triangle’s upper resistance again — a crucial inflection point.
🚀 What the Chart is Saying
The chart is signaling a potential bullish breakout. The consistent formation of higher lows shows increasing demand, and the price is now poised to test — and possibly break — the descending resistance.
If the breakout happens with above-average volume, it would validate the pattern and open the door for a sharp upward rally.
🎯 Trade Setup (When to Buy)
✅ Buy Entry:
- Wait for a confirmed breakout — a candle close above the upper trendline with strong volume.
- Ideally, price should break above the recent swing high to avoid a false breakout.
🛑 Stop Loss:
- Just below the most recent higher low or the triangle’s lower trendline.
🎯 Take Profit:
- Measure the widest part of the triangle and project it upward from the breakout point.
- This gives you a realistic and technical target area.
📌 Conclusion:
This symmetrical triangle is nearing its apex, and the current setup favors the bulls. A breakout above resistance, accompanied by volume, could offer a high-probability long trade. Patience is key — wait for confirmation before entering.
Disclaimer
The information and publications are not meant to be, and do not constitute, financial, investment, trading, or other types of advice or recommendations supplied or endorsed by TradingView. Read more in the Terms of Use.
Disclaimer
The information and publications are not meant to be, and do not constitute, financial, investment, trading, or other types of advice or recommendations supplied or endorsed by TradingView. Read more in the Terms of Use.