Key Technical Insights (Gold)
1) Fibonacci Confluence Zone:
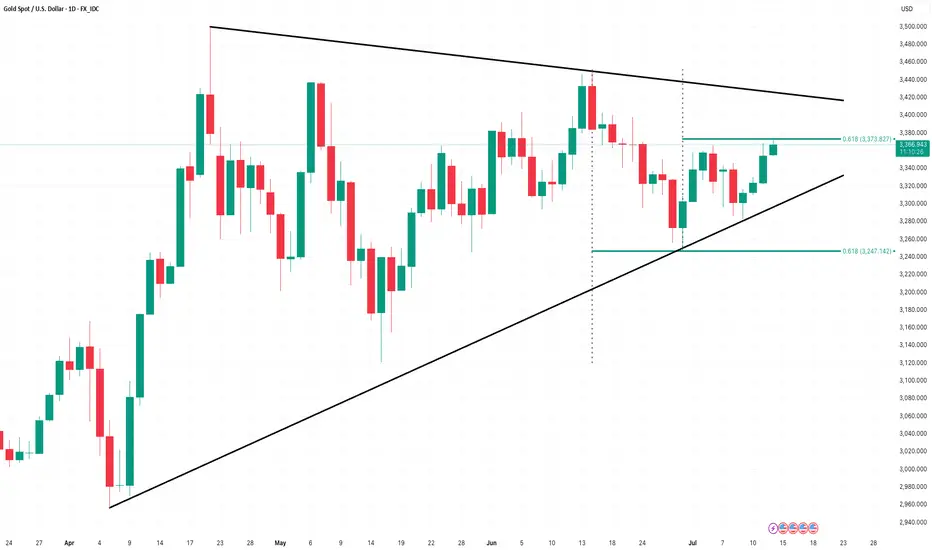
Now gold price action is currently compressed between two overlapping 61.8% Fibonacci retracement levels:
- Swing Low Retracement (61.8%) from the prior downtrend leg
- Swing High Retracement (61.8%) from the recent bullish move
This dual Fibonacci alignment reflects a high tension equilibrium between bullish and bearish forces, a typical precursor to breakout volatility.
2) Chart Pattern – Symmetrical Triangle:
Price is also developing a symmetrical triangle pattern, signaling a period of consolidation and potential energy buildup.
This structure usually leads to a breakout in the direction of the prevailing longer-term trend, which in this case remains bullish.
3) Momentum & Volatility:
RSI is holding in the mid-50s range — confirming market indecision.
Volume is contracting, consistent with the compression phase before expansion.
4) Mid-Term Outlook: Bullish Bias with Caution
Based on current technical conditions and macroeconomic context, the mid-term outlook for gold remains bullish, but requires patience and confirmation.
5) Strategic Levels to Watch:
- Breakout zone: $3,375 – $3,385
- Upside targets (if breakout holds): $3,435 → $3,495 → $3,520
- Bearish invalidation: Break below $3,240 would negate this bullish setup.
Gold is currently at a critical decision point compressed between technical resistance and structural support, forming a triangle at Fibonacci confluence. While the breakout direction is yet to be confirmed, probability favors a bullish resolution in alignment with the macro uptrend.
Traders and investors should remain patient, wait for confirmation, and manage risk accordingly.
1) Fibonacci Confluence Zone:
Now gold price action is currently compressed between two overlapping 61.8% Fibonacci retracement levels:
- Swing Low Retracement (61.8%) from the prior downtrend leg
- Swing High Retracement (61.8%) from the recent bullish move
This dual Fibonacci alignment reflects a high tension equilibrium between bullish and bearish forces, a typical precursor to breakout volatility.
2) Chart Pattern – Symmetrical Triangle:
Price is also developing a symmetrical triangle pattern, signaling a period of consolidation and potential energy buildup.
This structure usually leads to a breakout in the direction of the prevailing longer-term trend, which in this case remains bullish.
3) Momentum & Volatility:
RSI is holding in the mid-50s range — confirming market indecision.
Volume is contracting, consistent with the compression phase before expansion.
4) Mid-Term Outlook: Bullish Bias with Caution
Based on current technical conditions and macroeconomic context, the mid-term outlook for gold remains bullish, but requires patience and confirmation.
5) Strategic Levels to Watch:
- Breakout zone: $3,375 – $3,385
- Upside targets (if breakout holds): $3,435 → $3,495 → $3,520
- Bearish invalidation: Break below $3,240 would negate this bullish setup.
Gold is currently at a critical decision point compressed between technical resistance and structural support, forming a triangle at Fibonacci confluence. While the breakout direction is yet to be confirmed, probability favors a bullish resolution in alignment with the macro uptrend.
Traders and investors should remain patient, wait for confirmation, and manage risk accordingly.
Disclaimer
The information and publications are not meant to be, and do not constitute, financial, investment, trading, or other types of advice or recommendations supplied or endorsed by TradingView. Read more in the Terms of Use.
Disclaimer
The information and publications are not meant to be, and do not constitute, financial, investment, trading, or other types of advice or recommendations supplied or endorsed by TradingView. Read more in the Terms of Use.