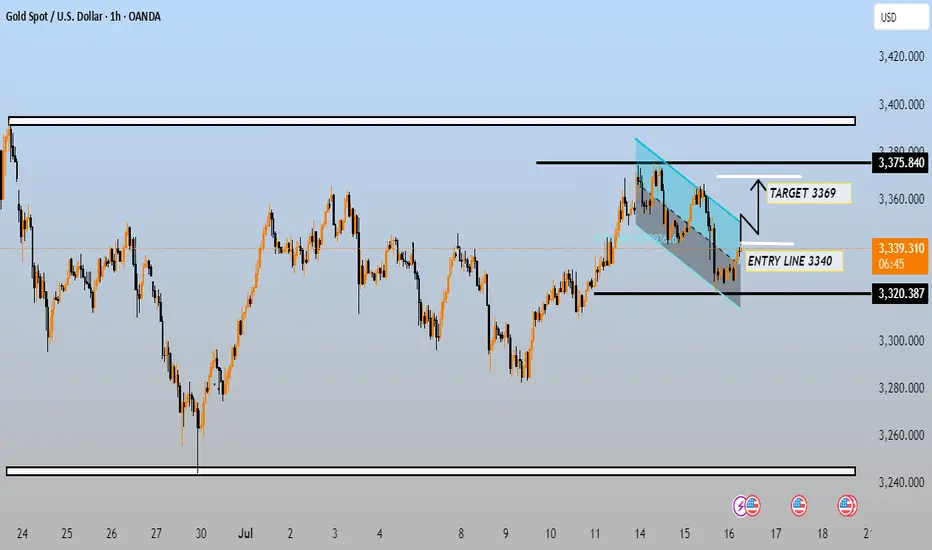
This chart shows the price action of Gold (XAU/USD) on a 1-hour timeframe with a bullish breakout setup. Here's a breakdown of the key technical elements:
---
🟦 Chart Overview:
Instrument: Gold Spot (XAU/USD)
Timeframe: 1 Hour (1h)
Current Price: $3,339.655
---
📉 Technical Patterns:
1. Falling Wedge / Bullish Flag:
A descending channel (blue) indicates a consolidation or retracement after a prior uptrend.
Price has just broken out of this wedge to the upside, which is typically a bullish signal.
2. Horizontal Support/Resistance:
Support Zone: Around $3,320.387
Resistance Zone: Around $3,375.840
---
📈 Trade Setup:
Entry Line: $3,340
Price has already moved slightly above this level.
Target: $3,369
A short-term target within the larger resistance zone at $3,375.840.
Stop-Loss (Implied): Below $3,320.387 (the lower support line), although not explicitly marked.
---
✅ Bullish Signals:
Breakout from a downward channel.
Strong bounce near support ($3,320).
Target level ($3,369) is realistic and below the next major resistance.
---
⚠ Risks:
If the price falls back below $3,340 and re-enters the wedge, the breakout could be invalid.
Strong resistance near $3,375 might limit further gains.
---
Conclusion: This is a classic bullish continuation setup after consolidation. If momentum holds, the $3,369 target is reasonable in the near term.
Would you like help calculating position size or risk-reward ratio for this trade?
---
🟦 Chart Overview:
Instrument: Gold Spot (XAU/USD)
Timeframe: 1 Hour (1h)
Current Price: $3,339.655
---
📉 Technical Patterns:
1. Falling Wedge / Bullish Flag:
A descending channel (blue) indicates a consolidation or retracement after a prior uptrend.
Price has just broken out of this wedge to the upside, which is typically a bullish signal.
2. Horizontal Support/Resistance:
Support Zone: Around $3,320.387
Resistance Zone: Around $3,375.840
---
📈 Trade Setup:
Entry Line: $3,340
Price has already moved slightly above this level.
Target: $3,369
A short-term target within the larger resistance zone at $3,375.840.
Stop-Loss (Implied): Below $3,320.387 (the lower support line), although not explicitly marked.
---
✅ Bullish Signals:
Breakout from a downward channel.
Strong bounce near support ($3,320).
Target level ($3,369) is realistic and below the next major resistance.
---
⚠ Risks:
If the price falls back below $3,340 and re-enters the wedge, the breakout could be invalid.
Strong resistance near $3,375 might limit further gains.
---
Conclusion: This is a classic bullish continuation setup after consolidation. If momentum holds, the $3,369 target is reasonable in the near term.
Would you like help calculating position size or risk-reward ratio for this trade?
Trade active
TARGET DONE ENJOYDisclaimer
The information and publications are not meant to be, and do not constitute, financial, investment, trading, or other types of advice or recommendations supplied or endorsed by TradingView. Read more in the Terms of Use.
Disclaimer
The information and publications are not meant to be, and do not constitute, financial, investment, trading, or other types of advice or recommendations supplied or endorsed by TradingView. Read more in the Terms of Use.