Analysis of key factors
Influence of CPI data
The core CPI in the United States in May only increased by 0.1%, which was lower than expected, indicating that inflation slowed down, and strengthened the market's expectations for the Fed's interest rate cut (it is now expected to cut interest rates by 77 basis points in the next year). After the data was released, gold rose to $3,360/ounce in the short term, and the US dollar index plunged, reflecting the rise in risk aversion.
However, we need to be vigilant about the subsequent market's revision of inflation expectations, especially if the Fed releases hawkish signals at the June interest rate meeting.
Key technical points
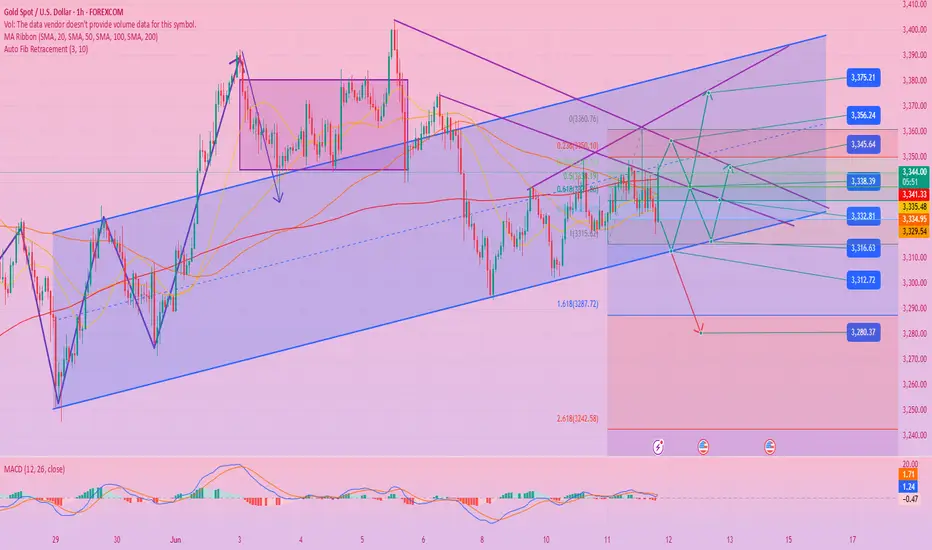
Resistance: 3360-3363 (intraday high), 3380-3382 (previous high pressure).
Support: 3300-3310 (short-term psychological barrier), 3293 (recent low).
Daily signal: The 5-day moving average crosses the 10-day moving average, but the gold price temporarily stands on the 5-day moving average, forming a price divergence, and we need to be vigilant about the risk of a high and fall.
Market sentiment
Geopolitics (trade friction, central bank gold purchases) still supports the long-term bullish logic of gold, but the short-term technical side shows that the bullish momentum is insufficient, and there is strong resistance above 3350.
Operation strategy suggestions
Short-term trading
Sell short order strategy: If the gold price rebounds to the 3365-3370 range and is blocked (especially if there is a long upper shadow or the 1-hour chart closes negative), you can short with a light position, with a target of 3330-3310 and a stop loss of 3385.
Buy long order strategy: If it pulls back to 3300-3310 and stabilizes (such as closing a cross star or a positive line rebound), you can short-term long, with a target of 3330-3350 and a stop loss of 3290.
Trend tracking
Breakthrough direction confirmation: If it effectively breaks through 3382, it may open up space to rise to 3400; if it falls below 3293, it will go down to the support of 3270-3250.
Be cautious in following orders: Currently in the range of shocks (3293-3360), avoid blindly following before breaking through the previous high/low.
Risk Warning
Event Risk: Pay attention to the results of the US Treasury auction. Weak demand may further boost gold safe-haven buying.
Technical Correction: If the daily MACD forms a bottom divergence, it may trigger a larger rebound, which needs to be judged in conjunction with the K-line pattern.
Summary: The main focus during the day is high-altitude, and short orders are entered after the key resistance level of 3365-3370 is under pressure. If it quickly breaks below 3330, positions can be increased; long orders are limited to light positions at the support level. Strictly stop loss and wait for trend-following opportunities after the range breaks.
Trade active
Gold multi-period resonance analysis
1. Daily level - trend strengthening stage
Structural breakthrough: The price effectively stood above the 3350 neckline (the upper edge of the previous oscillation range), and the daily closing was "engulfing the positive line", confirming the bullish dominance.
Moving average system: 5/10/20-day moving averages are arranged in a bullish pattern, MACD double lines diverge upward from the zero axis, and RSI (14) remains above 60 without overbought.
Key pressure: 3390-3400 area (weekly Fibonacci 78.6% retracement level).
2. 4-hour level - momentum verification
Wave structure: The 3320 low point can be regarded as the end of wave C, and the current running is sub-wave 3 of driving wave 3, with a theoretical target of 3415 (1.618 extension level).
Volume and price coordination: The rise is accompanied by an increase in trading volume, while the Asian session pullback is reduced, indicating that the selling pressure is limited.
3. 1-hour level - short-term trading anchor point
Time-sharing support:
Strong defensive position 3356 (starting point of Asian morning session + Bollinger middle rail)
Bull lifeline 3348 (previous high conversion support + V-shaped retracement 61.8% position)
Intraday channel: Currently running along the rising channel (lower rail 3355/upper rail 3395)
Today's three-dimensional trading strategy
▶ Main long plan
Best entry area: 3362-3355 (4-hour EMA10 and channel lower rail overlap area)
Position allocation: 50% main position, stop loss 3345 (stop loss moves up after breaking through the previous high)
Target 1: 3385 (equal amplitude measurement after breaking through the Asian session high)
Target 2: 3400 (reduce position by 50% in the daily pressure zone)
Target 3: 3415 (clear position at the wave theory target position)
▶ Auxiliary short opportunities
Counter-trend conditions: first touch 3408 and appear:
1-hour chart pregnancy line/evening star
MACD top divergence + shrinking trading volume
Operation: light position short (position ≤ 20%), stop loss 3418, target 3380
▶ Breakthrough chasing order strategy
Break above 3402: fall back to 3392 to chase long, stop loss 3385, target 3425
Break below 3348: rise and rebound to 3352 to short, stop loss 3360, target 3330
Related publications
Disclaimer
The information and publications are not meant to be, and do not constitute, financial, investment, trading, or other types of advice or recommendations supplied or endorsed by TradingView. Read more in the Terms of Use.
Related publications
Disclaimer
The information and publications are not meant to be, and do not constitute, financial, investment, trading, or other types of advice or recommendations supplied or endorsed by TradingView. Read more in the Terms of Use.