After three consecutive days of strong rebounds, spot gold has entered a period of sideways trading, trading around $3,370 in the European session, with a short-term seesaw pattern. A slight rebound in the US dollar index has weighed on gold prices, but market expectations of a September Fed rate cut remain supportive. Furthermore, lingering global trade uncertainty has prevented a significant decline in safe-haven demand.
Fundamentals:
Gold's recent upward momentum has been driven by weak US economic data and rising expectations of rate cuts. Last week's non-farm payroll data showed a significant weakening in the labor market, reinforcing market bets that the Fed will begin another round of rate cuts in September. The CME FedWatch tool shows that the market's expectation of a September rate cut has exceeded 90%. Meanwhile, US factory orders plummeted 4.8% in June, further highlighting economic weakness.
On the other hand, US President Trump signed an executive order last week raising tariffs on imports from dozens of countries, with the minimum tariff rate reaching 15% for countries with trade deficits with the US. With these measures about to take effect, this uncertainty continues to weigh on global market sentiment and supports gold's safe-haven properties.
However, a slight rebound in the US dollar partially offset gold's upward momentum. Traders will be watching the upcoming US ISM Services PMI data to determine whether the economic slowdown has spread to the services sector.
Technical Analysis:
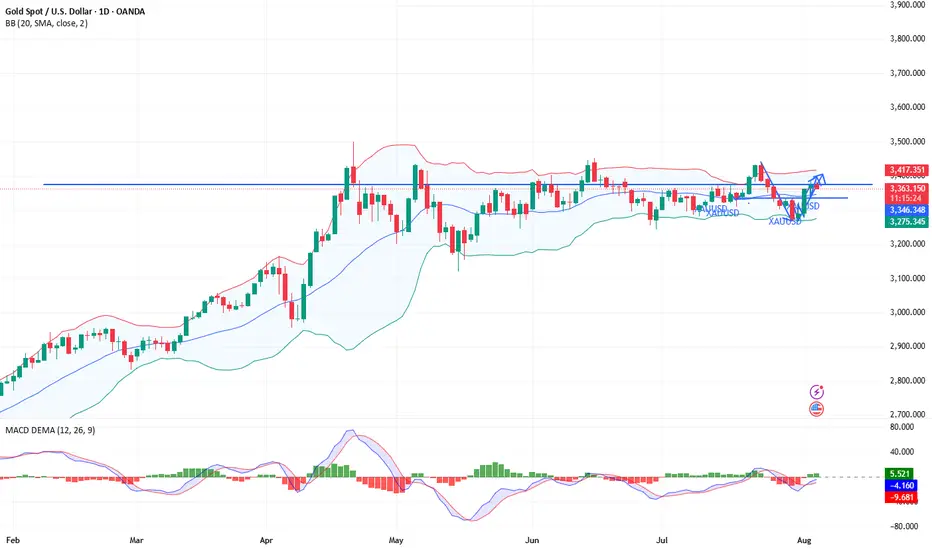
On the daily chart, gold prices have recently traded between the middle and upper Bollinger Bands (3343.59) and 3411.09, failing to break through key resistance. The overall trend remains within the medium-term range, with no clear trend emerging.
The recent candlestick chart pattern forms a typical "sideways fluctuation" pattern, indicating significant pressure near the previous high of 3438.80, while the lower Bollinger Band (3276.09) provides support, suggesting a short-term "box consolidation" pattern.
On the MACD indicator, the fast and slow lines are near the zero axis, while the DIFF and DEA lines have formed a slight golden cross, but the angle is gentle. The red bar has limited momentum, indicating insufficient upward momentum and a lack of a strong rebound.
The Relative Strength Index (RSI) remained at 54.81, within the neutral to strong range, indicating a lack of clear short-term price direction. Market sentiment remains cautious. Further attention will be paid to whether the price stabilizes above the middle Bollinger Band or retreats to test previous support levels.
Market Sentiment Observation:
Current gold market sentiment is cautiously optimistic. Traders are pricing in a high level of interest in the Federal Reserve's rate cut, driving a short-term rebound in gold prices. However, the dollar's resilience remains, limiting gold's upside potential. Indicators show a lack of significant inflows into gold ETFs, suggesting the market has not yet fully shifted to a defensive position.
The technical chart shows a typical "consolidation platform," indicating that the market is awaiting clearer policy or data guidance. Investors remain interested in safe-haven assets, but their willingness to chase higher prices is weak. In the short term, market sentiment may continue to be constrained by fluctuations in external macroeconomic data and shifting policy expectations.
Market Outlook:
Bull Perspective:
Analysts believe that if gold prices break through the upper Bollinger Band at 3411.09 and the MACD indicator expands, further upside potential is expected, with the previous high of $3450 in sight. If the Federal Reserve signals a clear interest rate cut or if the US economy continues to weaken, gold could see a mid-term trend reversal and resume its upward trend.
Bear Perspective:
Analysts believe that if gold prices remain constrained in the 3400-3411 range and fall below the middle Bollinger Band and moving average support, a short-term pullback could occur, testing the lower support band at $3276. If the ISM Services PMI exceeds expectations and the US dollar strengthens again, gold could return to bearish momentum. XAUUSD GOLD XAUUSD GOLD XAUUSD GOLD XAUUSD GOLDZ2025 GOLD
Fundamentals:
Gold's recent upward momentum has been driven by weak US economic data and rising expectations of rate cuts. Last week's non-farm payroll data showed a significant weakening in the labor market, reinforcing market bets that the Fed will begin another round of rate cuts in September. The CME FedWatch tool shows that the market's expectation of a September rate cut has exceeded 90%. Meanwhile, US factory orders plummeted 4.8% in June, further highlighting economic weakness.
On the other hand, US President Trump signed an executive order last week raising tariffs on imports from dozens of countries, with the minimum tariff rate reaching 15% for countries with trade deficits with the US. With these measures about to take effect, this uncertainty continues to weigh on global market sentiment and supports gold's safe-haven properties.
However, a slight rebound in the US dollar partially offset gold's upward momentum. Traders will be watching the upcoming US ISM Services PMI data to determine whether the economic slowdown has spread to the services sector.
Technical Analysis:
On the daily chart, gold prices have recently traded between the middle and upper Bollinger Bands (3343.59) and 3411.09, failing to break through key resistance. The overall trend remains within the medium-term range, with no clear trend emerging.
The recent candlestick chart pattern forms a typical "sideways fluctuation" pattern, indicating significant pressure near the previous high of 3438.80, while the lower Bollinger Band (3276.09) provides support, suggesting a short-term "box consolidation" pattern.
On the MACD indicator, the fast and slow lines are near the zero axis, while the DIFF and DEA lines have formed a slight golden cross, but the angle is gentle. The red bar has limited momentum, indicating insufficient upward momentum and a lack of a strong rebound.
The Relative Strength Index (RSI) remained at 54.81, within the neutral to strong range, indicating a lack of clear short-term price direction. Market sentiment remains cautious. Further attention will be paid to whether the price stabilizes above the middle Bollinger Band or retreats to test previous support levels.
Market Sentiment Observation:
Current gold market sentiment is cautiously optimistic. Traders are pricing in a high level of interest in the Federal Reserve's rate cut, driving a short-term rebound in gold prices. However, the dollar's resilience remains, limiting gold's upside potential. Indicators show a lack of significant inflows into gold ETFs, suggesting the market has not yet fully shifted to a defensive position.
The technical chart shows a typical "consolidation platform," indicating that the market is awaiting clearer policy or data guidance. Investors remain interested in safe-haven assets, but their willingness to chase higher prices is weak. In the short term, market sentiment may continue to be constrained by fluctuations in external macroeconomic data and shifting policy expectations.
Market Outlook:
Bull Perspective:
Analysts believe that if gold prices break through the upper Bollinger Band at 3411.09 and the MACD indicator expands, further upside potential is expected, with the previous high of $3450 in sight. If the Federal Reserve signals a clear interest rate cut or if the US economy continues to weaken, gold could see a mid-term trend reversal and resume its upward trend.
Bear Perspective:
Analysts believe that if gold prices remain constrained in the 3400-3411 range and fall below the middle Bollinger Band and moving average support, a short-term pullback could occur, testing the lower support band at $3276. If the ISM Services PMI exceeds expectations and the US dollar strengthens again, gold could return to bearish momentum.
Real-time strategies are like a beacon guiding your investment path. The market will never disappoint those who persevere and explore wisely....🚀🚀VIP Channel t.me/EagleEyePrecisionAnalysis
👉Exclusive address t.me/Eagle_PreciseAnalysis
👉Exclusive address t.me/Eagle_PreciseAnalysis
Disclaimer
The information and publications are not meant to be, and do not constitute, financial, investment, trading, or other types of advice or recommendations supplied or endorsed by TradingView. Read more in the Terms of Use.