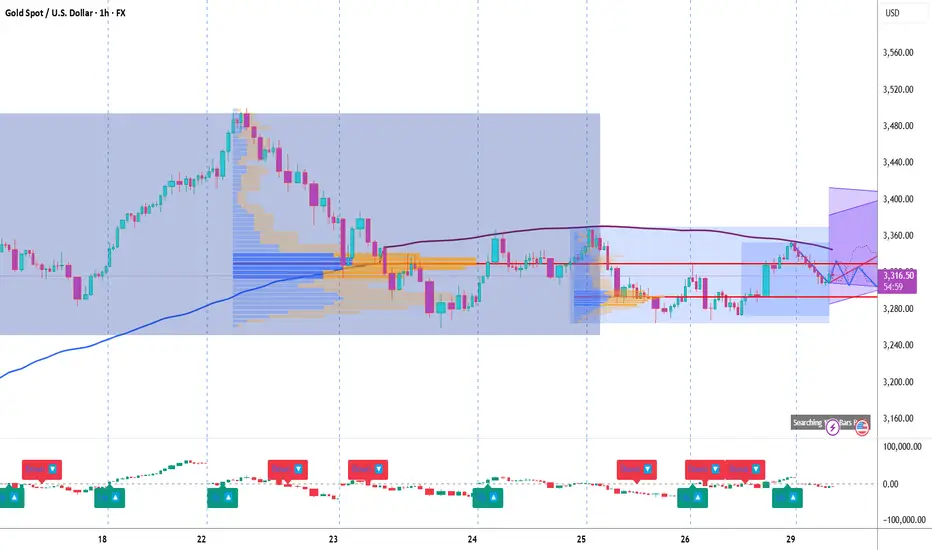
Here’s the detailed breakdown of the Gold Spot / USD (XAU/USD) 1H Chart based on Volume Profile, Gann analysis, and custom indicators (CVD + ADX):
1. Key Observations (Volume, Gann & CVD + ADX Focused)
a) Volume Profile Insights:
• Value Area High (VAH): 3,343.00
• Value Area Low (VAL): 3,278.50
• Point of Control (POC):
o Current session: 3,293.34
o Previous session: 3,329.53
• High-volume nodes:
o Around 3,293-3,300 (recent acceptance area)
• Low-volume gaps:
o Between 3,315 - 3,330 (thin volume, price may move quickly through)
b) Liquidity Zones:
• Stops likely above recent swing high: 3,343 (VAH area).
• Stops likely below recent swing low: 3,278 (VAL area).
• Absorption (high delta volume) noted near 3,290-3,300 (potential strong demand zone).
c) Volume-Based Swing Highs/Lows:
• Swing high at 3,343 with notable rejection and high-volume rejection candle.
• Swing low at 3,278.5 where volume spiked and buying pressure emerged.
d) CVD + ADX Indicator Analysis:
• Trend Direction: Currently slight bullish bias (CVD showing positive divergence).
• ADX Strength:
o ADX < 20 (currently weak trend, range-bound behavior likely).
• CVD Confirmation:
o Recent rising CVD with bullish price action = demand emerging.
________________________________________
2. Support & Resistance Levels
a) Volume-Based Levels:
• Support:
o VAL: 3,278.50
o POC: 3,293.34
• Resistance:
o VAH: 3,343.00
o Previous swing high: 3,343
b) Gann-Based Levels:
• Confirmed Gann swing low: 3,278
• Confirmed Gann swing high: 3,343
• Key retracement levels:
o 1/2 Retracement: ~3,310.5
o 1/3 Retracement: ~3,300
o 2/3 Retracement: ~3,320
________________________________________
3. Chart Patterns & Market Structure
a) Trend:
• Range-bound to slight bullish bias (based on ADX low + CVD rising).
b) Notable Patterns:
• Potential ascending channel forming (highlighted in purple).
• Breakout attempt from range, but not confirmed with strong volume yet.
• Minor flag pattern in consolidation near 3,293-3,300.
________________________________________
4. Trade Setup & Risk Management
a) Bullish Entry (If CVD + ADX confirm uptrend):
• Entry Zone: 3,293.50 – 3,295.00
• Targets:
o T1: 3,320
o T2: 3,343
• Stop-Loss (SL): 3,278
• RR: Minimum 1:2
b) Bearish Entry (If CVD + ADX confirm downtrend):
• Entry Zone: 3,343 (retest of VAH)
• Target:
o T1: 3,300
• Stop-Loss (SL): 3,355 (above prior swing high)
• RR: Minimum 1:2
c) Position Sizing:
• Risk 1-2% of capital per trade only.
Bharat Pandya @ProspireWealth
+91 9624044866
pandyabn76@gmail.com
+91 9624044866
pandyabn76@gmail.com
Disclaimer
The information and publications are not meant to be, and do not constitute, financial, investment, trading, or other types of advice or recommendations supplied or endorsed by TradingView. Read more in the Terms of Use.