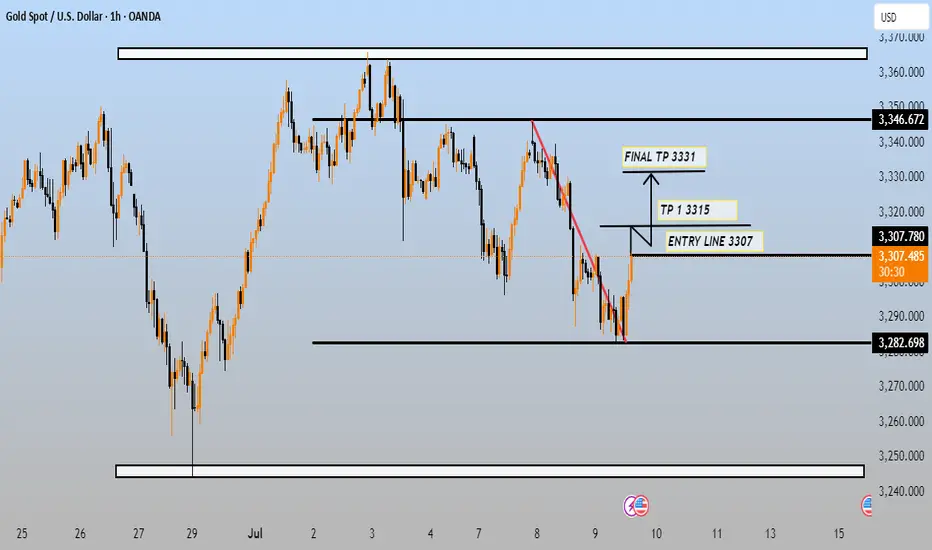
This chart shows a Gold Spot (XAU/USD) trading setup on the 1-hour timeframe, with key technical levels and a potential long trade idea. Here's a breakdown:
Key Levels:
Support Zone: 3,282.698 (Price recently bounced off this level)
Entry Line: 3,307 (near current price)
Take Profit (TP) Targets:
TP1: 3,315
Final TP: 3,331
Major Resistance: 3,346.672
Analysis:
Price Action: After a downtrend (highlighted with a red trendline), price bounced off a strong support level at 3,282.698 and is now rising.
Bullish Setup: The chart suggests a buy entry near 3,307, targeting a move up toward 3,331 (intermediate TP at 3,315).
Risk-Reward: Likely favorable, assuming a stop loss is set just below the recent low (not shown but would be below 3,282).
Strategy Insight:
Buy Entry Confirmation: Wait for a clear candle close above 3,307 to confirm breakout.
Manage Trade: Consider partial profits at 3,315 and move stop-loss to breakeven.
Would you like help calculating risk-reward ratios or position sizing for this setup?
Trade active
TP 1 DONE220 PIPS RUNING
Join telegram free...
t.me/+16bIVCNBo0MzYzk0
Forex Gold & Crypto Signals with
detailed analysis & get consistent |
result ...
Gold Signals with peoper TP & SL for
high profit ...
t.me/+16bIVCNBo0MzYzk0
t.me/+16bIVCNBo0MzYzk0
Forex Gold & Crypto Signals with
detailed analysis & get consistent |
result ...
Gold Signals with peoper TP & SL for
high profit ...
t.me/+16bIVCNBo0MzYzk0
Disclaimer
The information and publications are not meant to be, and do not constitute, financial, investment, trading, or other types of advice or recommendations supplied or endorsed by TradingView. Read more in the Terms of Use.