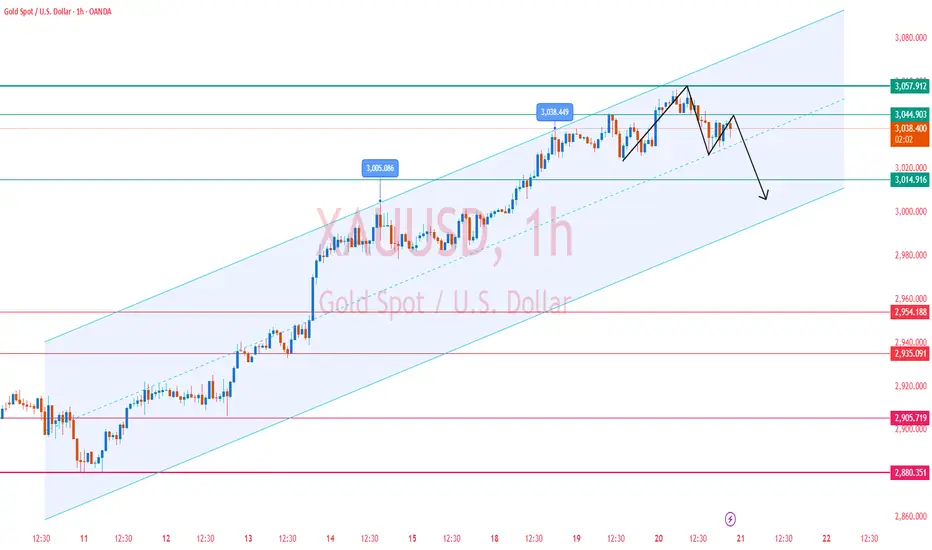
✅In the early Asian session today, the gold price quickly rose to 3056 and then came under significant pressure, forming a double top structure during the session. After the opening of the US session, the price has fallen back to around 3025, verifying the effectiveness of high-level selling pressure.
✅Currently, gold is showing a high-level downward trend in the 1-hour cycle. If the price continues to fall and rebounds but fails to break through the new high, it may gradually form the prototype of a head and shoulders top pattern. Overall, gold is in a high-level decline stage, and market sentiment tends to be cautious. Do not blindly chase more.
✅The current upper resistance is in the 3042-3045 range, which is also the watershed between long and short positions. If the upward breakthrough fails, it means that there may be a further correction tomorrow. If it can successfully break through today, a new high may appear.
✅Short-term Key price points
🔴Upper resistance level:
-First: 3045-3050
-Second: 3038-3042
🟢Lower support level:
-First: 3020-3022
-Second: 3005-3012
✅Intraday trading strategy
🔰Aggressive strategy
--Entry: Rebound to 3038-3042 and try short with a light position (position ≤ 3%)
--Stop loss: 3047 (break through the previous high + 0.5 times ATR)
--Target: 3022→3008 (1:3 risk-reward ratio)
🔰Solid strategy
--Wait for the price to test the 3020-3022 support band:
--If there is a bullish engulfing + RSI bottom divergence, enter a long order (stop loss 3015)
-- If the volume falls below 3018, chase the short to 3005 (stop loss 3025)
🔷Trading strategies are time-sensitive. We will provide real-time and accurate trading strategies based on market changes. Please stay tuned.
🔶The current market situation is in a high-risk state. Trading on your own may result in huge losses. Our professional guidance can help you avoid risks while obtaining continuous and stable profits🤝
Trade active
✅The gold price formed a significant top structure at 3047 in the early trading, and the 4-hour chart closed three consecutive real negative lines. A typical bearish engulfing pattern appeared: the last negative line entity completely covered the previous positive line entity, and the entity accounted for more than 70%. The rebound momentum was exhausted, and the price showed the characteristics of "high point moving down, low point moving down" in the key resistance area.✅Key price level analysis
🔴Resistance area
--Primary resistance: 3047-3050 (previous high + integer level)
--Secondary resistance: 3035 (Asian session rebound high, now converted into dynamic resistance)
🟢Support area
--Intraday support: 3025-3020 (overnight low + Fibonacci 38.2% retracement level)
--Strong support band: 3005-3000 (psychological level + 50% retracement level + EMA60)
✅Intraday trading strategy:
🔰Short when rebounding to 3045-3050 area, stop loss set above 3055
Target positions look down to 3035/3025/3015 in turn
🔰If it effectively breaks below 3020, you can short with a light position to the 3005-3000 area
🔰When the 3005-3000 support band is touched for the first time, you can try to rebound long orders, with a stop loss below 2995
Disclaimer
The information and publications are not meant to be, and do not constitute, financial, investment, trading, or other types of advice or recommendations supplied or endorsed by TradingView. Read more in the Terms of Use.
Disclaimer
The information and publications are not meant to be, and do not constitute, financial, investment, trading, or other types of advice or recommendations supplied or endorsed by TradingView. Read more in the Terms of Use.