Gold technical analysis and trading strategy
[Technical pattern analysis]
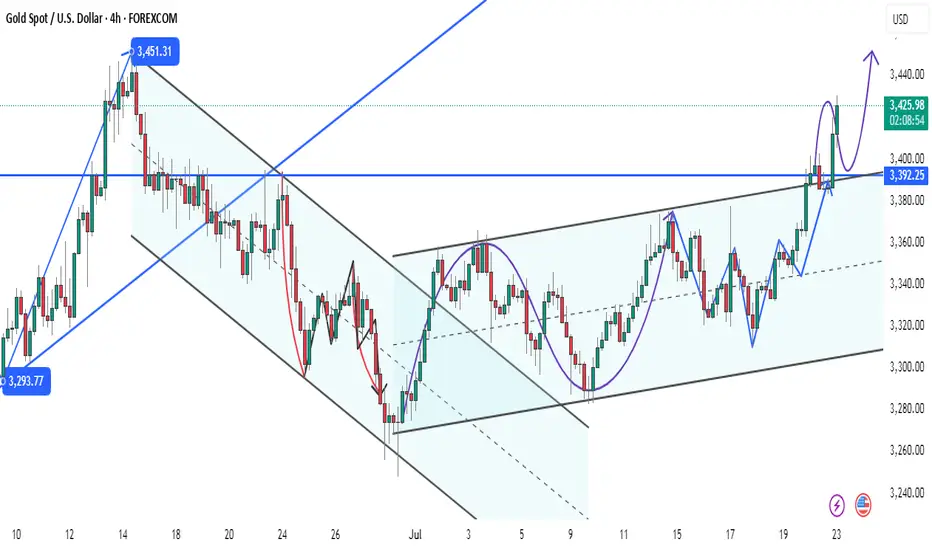
From the daily level, the gold price has confirmed that it has broken through the lower track support of the large convergence triangle, forming a typical three-day continuous pull-up pattern. Yesterday's big positive line was full of entities, not only breaking through the 3365-3377 area of the previous few weeks of shock highs, but also standing on the 3380 mark of the small convergence triangle trend pressure level, which opened up technical space for subsequent rises.
The 4-hour chart shows that the price continued to strengthen after breaking through the middle track, and the MACD indicator golden cross ran well, indicating that the bullish momentum is increasing. It is worth noting that the previous resistance area of 3365-3377 has now been transformed into an important support belt, and together with the 5-day moving average of 3360, it constitutes a callback defense line.
【Key price analysis】
Support:
The primary support is in the 3380-3383 range, which is the resonance area of the trend line conversion support and the middle track of the hourly chart
The secondary support is at 3360-3365, including the 5-day moving average and the previous breakthrough position
Resistance:
The short-term primary target is the 3408-3420 area, which is the upper track of the large convergence triangle
After the breakthrough, it will challenge the space above 3450, and then a unilateral upward trend may be launched
【Disk details observation】
In the morning, the gold price experienced a technical correction after testing the overnight high of 3401, but it remained above the 3380 support. From the hourly chart:
There is obvious buying in the 3382-3383 area
Although the price briefly fell below the middle track of 3386, it quickly recovered the lost ground
If the US market can regain the 3400 mark, it will confirm the start of a new round of upward attack
It is particularly worth noting that the current market presents a typical time-for-space feature. If the 3380 support fails to be effectively broken before 22:00, it is likely to complete the adjustment through sideways consolidation and then directly start the upward attack.
[Trading strategy suggestions]
"In the context of a clear positive trend, it is recommended to adopt a trading strategy of mainly doing more on pullbacks:
Ideal entry point for long orders: 3400-3405 range
Strict stop loss setting: below 3395
Initial target: 3415-3420 area
After breaking through 3420, you can continue to hold and look at 3450
For aggressive traders, you can try to go long with a light position in the 3400-3410 support area, but you need to strictly control your position. Conservative investors can wait for the price to stabilize at 3400 before intervening."
Professional reminder: "The essence of trend trading is to follow the trend. The current gold price has formed a complete upward channel, and each pullback is a good opportunity to arrange long orders. But you need to pay attention to controlling your position and guard against the short-term volatility risks that may occur in the US market."
[Technical pattern analysis]
From the daily level, the gold price has confirmed that it has broken through the lower track support of the large convergence triangle, forming a typical three-day continuous pull-up pattern. Yesterday's big positive line was full of entities, not only breaking through the 3365-3377 area of the previous few weeks of shock highs, but also standing on the 3380 mark of the small convergence triangle trend pressure level, which opened up technical space for subsequent rises.
The 4-hour chart shows that the price continued to strengthen after breaking through the middle track, and the MACD indicator golden cross ran well, indicating that the bullish momentum is increasing. It is worth noting that the previous resistance area of 3365-3377 has now been transformed into an important support belt, and together with the 5-day moving average of 3360, it constitutes a callback defense line.
【Key price analysis】
Support:
The primary support is in the 3380-3383 range, which is the resonance area of the trend line conversion support and the middle track of the hourly chart
The secondary support is at 3360-3365, including the 5-day moving average and the previous breakthrough position
Resistance:
The short-term primary target is the 3408-3420 area, which is the upper track of the large convergence triangle
After the breakthrough, it will challenge the space above 3450, and then a unilateral upward trend may be launched
【Disk details observation】
In the morning, the gold price experienced a technical correction after testing the overnight high of 3401, but it remained above the 3380 support. From the hourly chart:
There is obvious buying in the 3382-3383 area
Although the price briefly fell below the middle track of 3386, it quickly recovered the lost ground
If the US market can regain the 3400 mark, it will confirm the start of a new round of upward attack
It is particularly worth noting that the current market presents a typical time-for-space feature. If the 3380 support fails to be effectively broken before 22:00, it is likely to complete the adjustment through sideways consolidation and then directly start the upward attack.
[Trading strategy suggestions]
"In the context of a clear positive trend, it is recommended to adopt a trading strategy of mainly doing more on pullbacks:
Ideal entry point for long orders: 3400-3405 range
Strict stop loss setting: below 3395
Initial target: 3415-3420 area
After breaking through 3420, you can continue to hold and look at 3450
For aggressive traders, you can try to go long with a light position in the 3400-3410 support area, but you need to strictly control your position. Conservative investors can wait for the price to stabilize at 3400 before intervening."
Professional reminder: "The essence of trend trading is to follow the trend. The current gold price has formed a complete upward channel, and each pullback is a good opportunity to arrange long orders. But you need to pay attention to controlling your position and guard against the short-term volatility risks that may occur in the US market."
Disclaimer
The information and publications are not meant to be, and do not constitute, financial, investment, trading, or other types of advice or recommendations supplied or endorsed by TradingView. Read more in the Terms of Use.
Disclaimer
The information and publications are not meant to be, and do not constitute, financial, investment, trading, or other types of advice or recommendations supplied or endorsed by TradingView. Read more in the Terms of Use.