🔍 Momentum Analysis
D1 timeframe: Momentum is still trending downward, but we’re starting to see signs of convergence between the indicator lines. Normally, we would expect another two daily candles to reach the oversold zone and trigger a potential reversal. However, with the current narrowing pattern, we cannot rule out the possibility of an earlier reversal. Today’s daily close will be crucial for confirmation.
H4 timeframe: Momentum is clearly declining, suggesting that the market may either continue downwards or consolidate sideways throughout the day.
🌀 Elliott Wave Structure
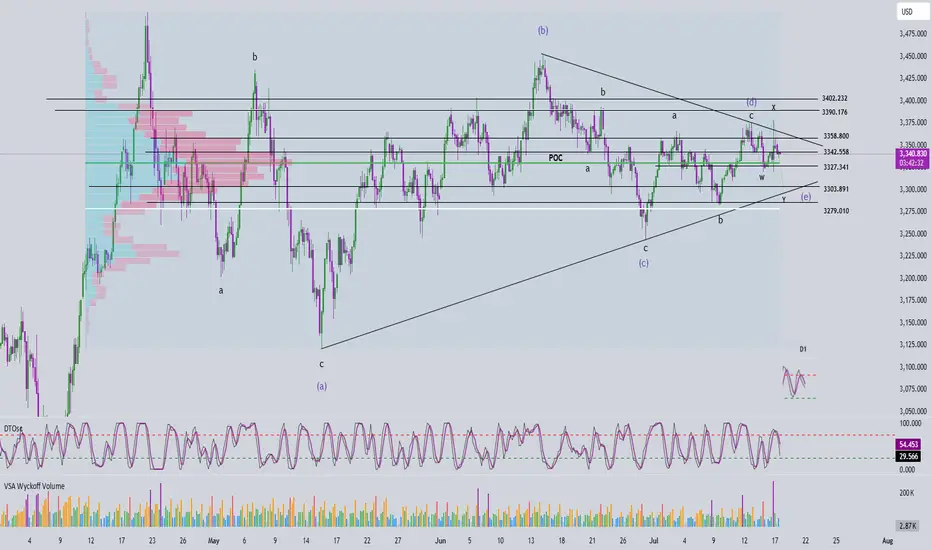
On the H4 chart, price action is compressing tightly at the end of a symmetrical triangle pattern – a classic setup in Elliott Wave theory. Notably, this final point of compression coincides with the POC (Point of Control), indicating a key price level where high volume has accumulated.
Wave W (in black) follows a 3-wave structure. Yesterday, price surged to the beginning of wave W and then sharply reversed, forming the basis for two potential scenarios:
Scenario 1 – WXY structure with current price completing wave Y within wave e (green):
+ Target 1: 3327
+ Target 2: 3303
Scenario 2 – Wave e (green) evolves into a triangle:
+ In this case, price may consolidate sideways above the 3327 zone.
🔗 Combining Wave and Momentum Analysis
Both D1 and H4 momentum indicators are still pointing downward. However, the price candles appear overlapping and lack clear directional strength – a common trait of compression near the triangle’s apex. With price sitting right on the POC, there’s a high chance of continued tightening before a breakout. At this stage, the recommended strategy is to wait for a strong bullish candle at one of the target zones before entering a BUY position.
📈 Trade Setup
✅ Scenario 1 – BUY at 3327 – 3326
+ Stop Loss: 3317
+ Take Profit 1: 3342
+ Take Profit 2: 3358
+ Take Profit 3: 3402
✅ Scenario 2 – BUY at 3305 – 3302
+ Stop Loss: 3295
+ Take Profit 1: 3327
+ Take Profit 2: 3358
+ Take Profit 3: 3402
Trade active
"It’s a pity that price is approaching TP2 and we’re not on board."But this is completely normal in a trader’s journey. No one can catch every wave — what truly matters is maintaining a strong mindset and continuously improving your skills.
Once you become proficient at reading the market, you’ll know how to make the most of the signals and insights I share.
📍 At the moment, the price zone between 3390 – 3402 is a critical area that deserves close attention.
This is where we’ll get our answer: Has the bullish trend — Wave 3 — truly begun?
✅ If price breaks above 3402 and continues expanding into the 3431 – 3450 zone, that would be a strong signal that Wave 3 is forming, confirming that the bullish trend is officially underway.
❗ However, if during the Asian session tomorrow, we see daily (D1) momentum begin to reverse downward while price remains stuck between 3390 – 3402, it’s likely that the corrective phase is still ongoing.
📌 I’ll be watching closely and will update a new trading plan tomorrow to give the team a clearer outlook and actionable setup.
👉
👉 Join the channel to receive more scalping signals!
Channel Telegram: t.me/+XkFQ95yHVOEwNDc1
Channel Telegram: t.me/+XkFQ95yHVOEwNDc1
Related publications
Disclaimer
The information and publications are not meant to be, and do not constitute, financial, investment, trading, or other types of advice or recommendations supplied or endorsed by TradingView. Read more in the Terms of Use.