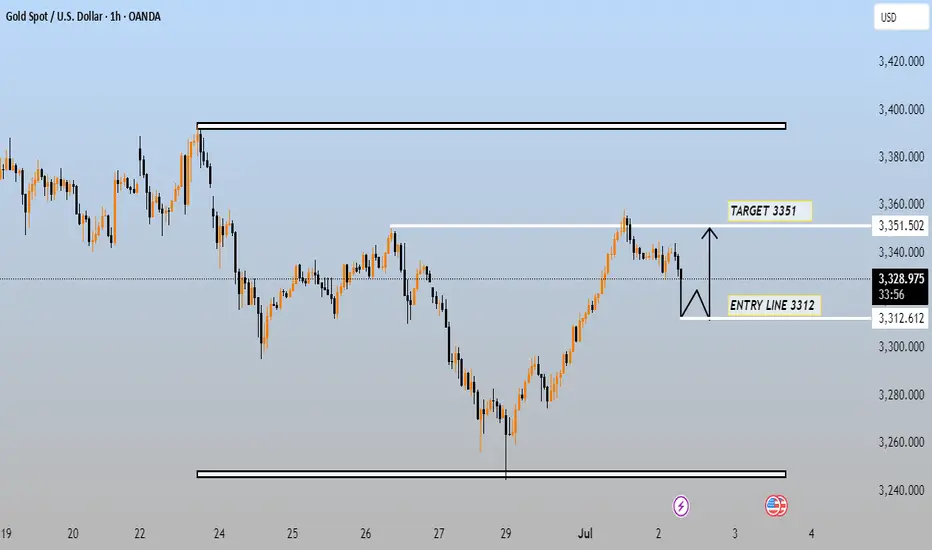
This chart is of Gold Spot against the U.S. Dollar (XAU/USD) on the 1-hour timeframe. It outlines a potential long (buy) trade setup based on a technical formation.
Key Elements:
Entry Line: 3312
Target Line: 3351
Current Price: 3329.510
Price Range for Trade Setup: Roughly 40 points (from 3312 to 3351)
Interpretation:
1. Setup Type:
This appears to be a bullish breakout/retest pattern. The trader anticipates a dip to around 3312, then a bounce upward to the target of 3351.
2. Market Context:
The price is moving within a broader range-bound structure, with horizontal resistance around 3,400 and support near 3,240.
The recent price action suggests a pullback after a strong rally, potentially forming a higher low before resuming the upward trend.
3. Entry Strategy:
Wait for price to pull back near the 3312 support level, which previously acted as resistance.
Entry is likely intended on a bullish confirmation (e.g., bullish candlestick pattern or bounce).
4. Risk-Reward:
Risk: Entry near 3312 with stop just below (e.g., 3300 or lower).
Reward: Target at 3351 gives a potential gain of ~39 points.
Summary:
The chart suggests a buy-the-dip strategy in gold (XAU/USD) with a projected upward move from the 3312 level to 3351, banking on a successful retest of the breakout area. It's a short-term trade inside a larger consolidation zone.
Let me know if you'd like help calculating the risk/reward ratio, setting stop loss, or automating this with a trading bot or script.
Trade active
TARGET DONEJoin telegram free...
t.me/+16bIVCNBo0MzYzk0
Forex Gold & Crypto Signals with
detailed analysis & get consistent |
result ...
Gold Signals with peoper TP & SL for
high profit ...
t.me/+16bIVCNBo0MzYzk0
t.me/+16bIVCNBo0MzYzk0
Forex Gold & Crypto Signals with
detailed analysis & get consistent |
result ...
Gold Signals with peoper TP & SL for
high profit ...
t.me/+16bIVCNBo0MzYzk0
Disclaimer
The information and publications are not meant to be, and do not constitute, financial, investment, trading, or other types of advice or recommendations supplied or endorsed by TradingView. Read more in the Terms of Use.
Join telegram free...
t.me/+16bIVCNBo0MzYzk0
Forex Gold & Crypto Signals with
detailed analysis & get consistent |
result ...
Gold Signals with peoper TP & SL for
high profit ...
t.me/+16bIVCNBo0MzYzk0
t.me/+16bIVCNBo0MzYzk0
Forex Gold & Crypto Signals with
detailed analysis & get consistent |
result ...
Gold Signals with peoper TP & SL for
high profit ...
t.me/+16bIVCNBo0MzYzk0
Disclaimer
The information and publications are not meant to be, and do not constitute, financial, investment, trading, or other types of advice or recommendations supplied or endorsed by TradingView. Read more in the Terms of Use.