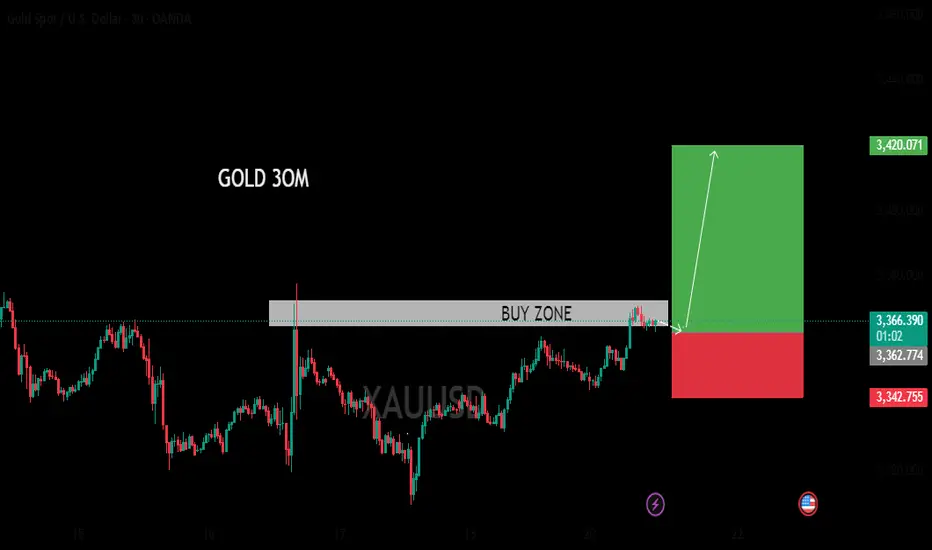
Market may be goint to buy side. A line graph with price movements indicated by red and blue lines. A "BUY ZONE" highlighted on the chart, suggesting a potential buying opportunity based on the price level. A green box on the right side of the chart with an upward arrow, indicating a predicted price increase
Trade active
target achieved .Disclaimer
The information and publications are not meant to be, and do not constitute, financial, investment, trading, or other types of advice or recommendations supplied or endorsed by TradingView. Read more in the Terms of Use.
Disclaimer
The information and publications are not meant to be, and do not constitute, financial, investment, trading, or other types of advice or recommendations supplied or endorsed by TradingView. Read more in the Terms of Use.