Next Monday: Gold price can wait for 3300-3320 to short
Latest gold market news and analysis in June:
1. Gold price fell sharply, falling for the second consecutive week
Spot gold fell 2.8% this week, closing at $3273/ounce on Friday, and fell below $3255 during the session, hitting a new low in nearly a month.
2. Analysis of the reasons for the decline
The situation in the Middle East has eased: Israel and Iran have reached a ceasefire agreement, weakening the safe-haven demand for gold.
Market risk appetite has rebounded: European and American stock markets have risen, and some funds have shifted from gold to stocks.
Changes in the Fed's interest rate cut expectations: Although the market expects the probability of a rate cut in September to rise to 75%, the probability of a rate cut in July is only 20%, and short-term support is insufficient.
The dollar is weak but gold prices have not benefited: The US dollar index fell 1.47% this week, but gold failed to get a boost, indicating that the safe-haven premium has subsided.
3. Market sentiment is divided:
The survey shows that 41% of investors expect gold prices to rise next week, 46% are bearish, and 13% are neutral.
4. Future focus:
July 9 tariff negotiation deadline: If the United States reaches an agreement with trading partners such as the European Union, it may further weaken safe-haven demand.
Fed policy signals: Pay attention to speeches by Fed officials next week and June non-farm data.
Geopolitical risks: Although the situation in the Middle East has eased, potential conflicts may still push up risk aversion again.
5. Technical analysis:
Support level: $3,250 (if broken, it may fall to $3,120).
Resistance level: $3,300-3,346 range, or challenge $3,450 after breaking through.
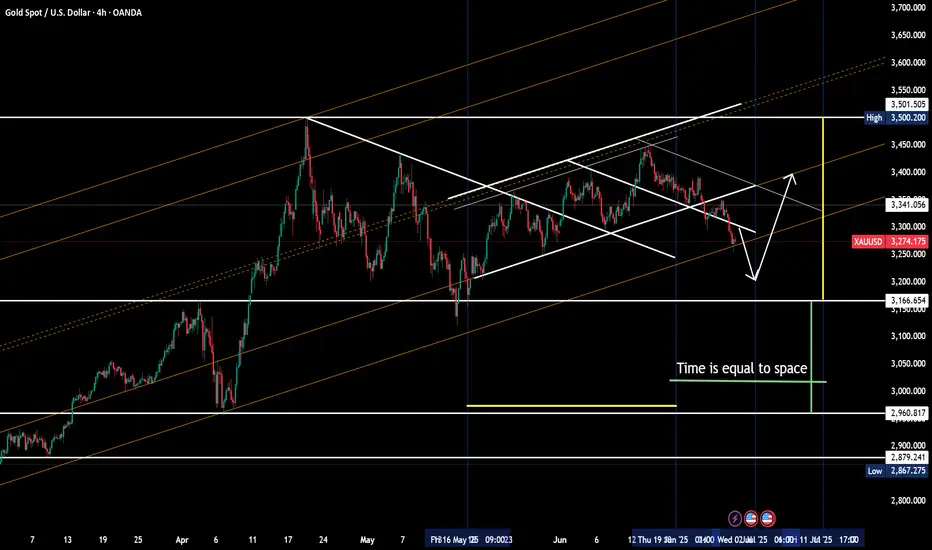
Gold 4-hour chart:
High pressure zone: 3280-3300
Support zone: 3250-3260
Market analysis:
The current daily chart is running in a larger range;
Intraday long range: 3250-3260.
Intraday short range: 3280--3300--3345.
The 4-hour structure continues to fall and weaken, and short selling should be active at present.
Next week, aim at the upper 3300-3310-20-30 pressure level, stagflation reversal K-line appears, enter the market and short
Latest gold market news and analysis in June:
1. Gold price fell sharply, falling for the second consecutive week
Spot gold fell 2.8% this week, closing at $3273/ounce on Friday, and fell below $3255 during the session, hitting a new low in nearly a month.
2. Analysis of the reasons for the decline
The situation in the Middle East has eased: Israel and Iran have reached a ceasefire agreement, weakening the safe-haven demand for gold.
Market risk appetite has rebounded: European and American stock markets have risen, and some funds have shifted from gold to stocks.
Changes in the Fed's interest rate cut expectations: Although the market expects the probability of a rate cut in September to rise to 75%, the probability of a rate cut in July is only 20%, and short-term support is insufficient.
The dollar is weak but gold prices have not benefited: The US dollar index fell 1.47% this week, but gold failed to get a boost, indicating that the safe-haven premium has subsided.
3. Market sentiment is divided:
The survey shows that 41% of investors expect gold prices to rise next week, 46% are bearish, and 13% are neutral.
4. Future focus:
July 9 tariff negotiation deadline: If the United States reaches an agreement with trading partners such as the European Union, it may further weaken safe-haven demand.
Fed policy signals: Pay attention to speeches by Fed officials next week and June non-farm data.
Geopolitical risks: Although the situation in the Middle East has eased, potential conflicts may still push up risk aversion again.
5. Technical analysis:
Support level: $3,250 (if broken, it may fall to $3,120).
Resistance level: $3,300-3,346 range, or challenge $3,450 after breaking through.
Gold 4-hour chart:
High pressure zone: 3280-3300
Support zone: 3250-3260
Market analysis:
The current daily chart is running in a larger range;
Intraday long range: 3250-3260.
Intraday short range: 3280--3300--3345.
The 4-hour structure continues to fall and weaken, and short selling should be active at present.
Next week, aim at the upper 3300-3310-20-30 pressure level, stagflation reversal K-line appears, enter the market and short
Disclaimer
The information and publications are not meant to be, and do not constitute, financial, investment, trading, or other types of advice or recommendations supplied or endorsed by TradingView. Read more in the Terms of Use.
Disclaimer
The information and publications are not meant to be, and do not constitute, financial, investment, trading, or other types of advice or recommendations supplied or endorsed by TradingView. Read more in the Terms of Use.