Gold Spot (XAU/USD) Technical Outlook – 1H Chart
📅 June 4th, 2025
📈 Analysis by mmozafari1357
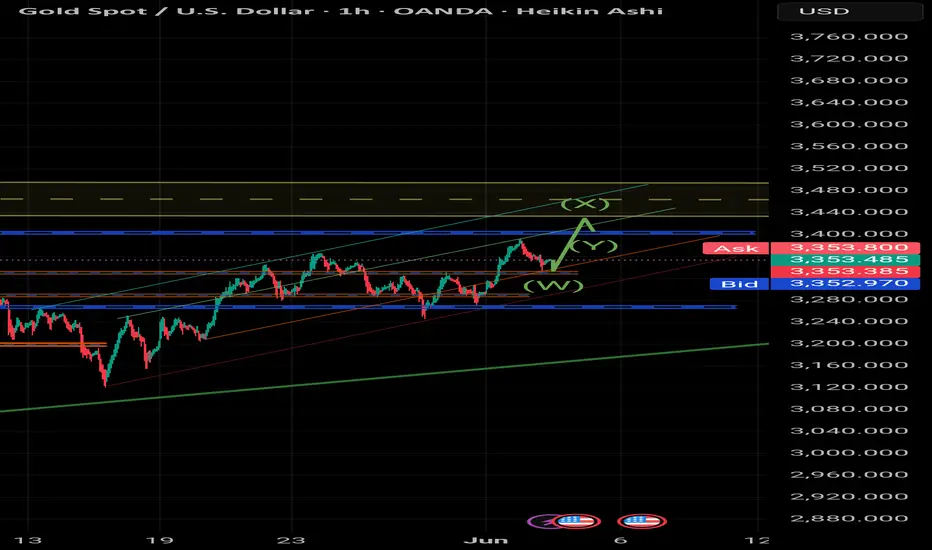
We are currently observing a complex WXY corrective pattern forming within a well-defined bullish channel on the 1H timeframe.
Wave W completed after a strong impulsive move from the lower support zone around $3,250.
Wave X is expected to extend higher and reach the $3,450–$3,470 resistance zone, which aligns with the upper boundary of the parallel channel and a historical supply area.
Currently, price seems to be forming wave Y as a retracement, creating a higher low structure before the anticipated bullish continuation.
🟢 Bias: Bullish continuation expected toward the $3,450 zone.
🔵 Key Levels:
Support: $3,320 – $3,335
Resistance: $3,420 – $3,470
This setup remains valid as long as price stays within the ascending channel and maintains higher lows.
---
🔖 Posted by: mmozafari1357
🧠 Stay patient, stay disciplined, and let the structure guide you.
📅 June 4th, 2025
📈 Analysis by mmozafari1357
We are currently observing a complex WXY corrective pattern forming within a well-defined bullish channel on the 1H timeframe.
Wave W completed after a strong impulsive move from the lower support zone around $3,250.
Wave X is expected to extend higher and reach the $3,450–$3,470 resistance zone, which aligns with the upper boundary of the parallel channel and a historical supply area.
Currently, price seems to be forming wave Y as a retracement, creating a higher low structure before the anticipated bullish continuation.
🟢 Bias: Bullish continuation expected toward the $3,450 zone.
🔵 Key Levels:
Support: $3,320 – $3,335
Resistance: $3,420 – $3,470
This setup remains valid as long as price stays within the ascending channel and maintains higher lows.
---
🔖 Posted by: mmozafari1357
🧠 Stay patient, stay disciplined, and let the structure guide you.
Related publications
Disclaimer
The information and publications are not meant to be, and do not constitute, financial, investment, trading, or other types of advice or recommendations supplied or endorsed by TradingView. Read more in the Terms of Use.
Related publications
Disclaimer
The information and publications are not meant to be, and do not constitute, financial, investment, trading, or other types of advice or recommendations supplied or endorsed by TradingView. Read more in the Terms of Use.