Gold price fluctuation range: 3340-3380
1. The main reason for the current decline in gold prices
The rebound of the US dollar index
The US dollar index has stabilized and rebounded recently, approaching the 98 mark, weakening the attractiveness of gold.
The minutes of the Fed's June meeting showed that most officials were cautious about interest rate cuts, and the probability of keeping interest rates unchanged in July was as high as 93.3%. The market's expectations for loose policies have cooled down.
The market digests Trump's tariff policy
Although Trump announced a 30% tariff on the European Union and Mexico (effective on August 1), the market believes that this may be part of the negotiation strategy, and risk aversion has not continued to heat up.
Some investors chose to take profits, causing gold prices to fall from the intraday high of $3,374 to around $3,345.
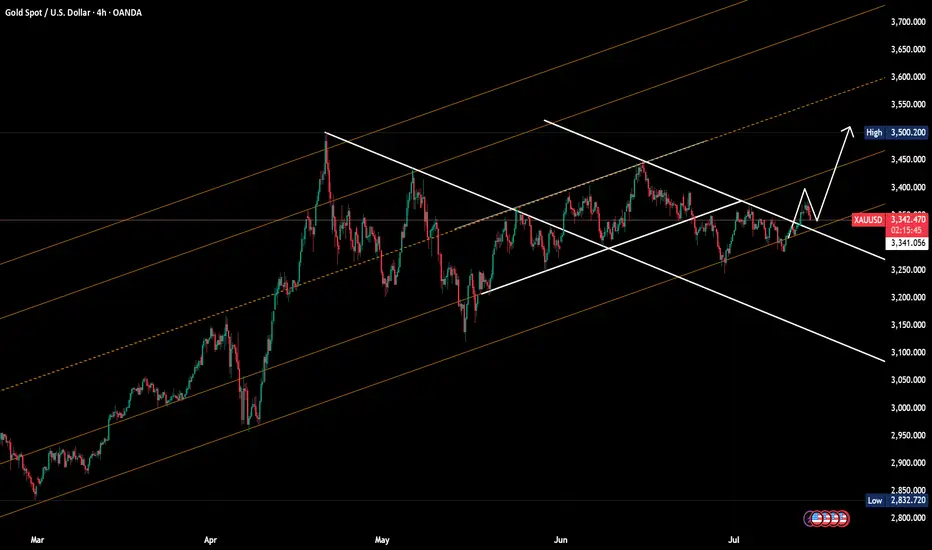
Technical analysis
Key support and resistance levels
Support levels: $3,341 (21-day moving average), $3,326 (50-day moving average), $3,300 (psychological level).
Resistance levels: $3377 (23.6% Fibonacci level), $3400 (integer level), $3450 (previous high).
Current strategy, shock thinking:
Low price long, range 3340-3350, stop loss: 3330, target: 3375-3380
1. The main reason for the current decline in gold prices
The rebound of the US dollar index
The US dollar index has stabilized and rebounded recently, approaching the 98 mark, weakening the attractiveness of gold.
The minutes of the Fed's June meeting showed that most officials were cautious about interest rate cuts, and the probability of keeping interest rates unchanged in July was as high as 93.3%. The market's expectations for loose policies have cooled down.
The market digests Trump's tariff policy
Although Trump announced a 30% tariff on the European Union and Mexico (effective on August 1), the market believes that this may be part of the negotiation strategy, and risk aversion has not continued to heat up.
Some investors chose to take profits, causing gold prices to fall from the intraday high of $3,374 to around $3,345.
Technical analysis
Key support and resistance levels
Support levels: $3,341 (21-day moving average), $3,326 (50-day moving average), $3,300 (psychological level).
Resistance levels: $3377 (23.6% Fibonacci level), $3400 (integer level), $3450 (previous high).
Current strategy, shock thinking:
Low price long, range 3340-3350, stop loss: 3330, target: 3375-3380
Disclaimer
The information and publications are not meant to be, and do not constitute, financial, investment, trading, or other types of advice or recommendations supplied or endorsed by TradingView. Read more in the Terms of Use.
Disclaimer
The information and publications are not meant to be, and do not constitute, financial, investment, trading, or other types of advice or recommendations supplied or endorsed by TradingView. Read more in the Terms of Use.