1. Core driving factors of fundamentals
Weak US economic data strengthens expectations of interest rate cuts
PPI and retail sales data fell beyond expectations: US PPI fell 0.5% month-on-month in April (expected +0.2%), retail sales growth dropped sharply from 1.7% in March to 0.1%, and manufacturing output fell 0.4%, indicating that the pressure of economic slowdown has intensified. This data directly led to a sharp drop in US Treasury yields (10-year yields fell 11 basis points to 4.435%), and market expectations for the Fed's interest rate cuts increased (the probability of a rate cut in September is expected to rise to 75.4%).
Weak US dollar: The US dollar index fell 0.2% to 100.82, and the real interest rate (TIPS yield) fell below 1.8%, providing pricing support for gold.
Geopolitical risks escalate
Russia-Ukraine peace talks are deadlocked: Putin refused to attend the Turkey talks and only sent a low-level delegation. Ukrainian President Zelensky called this move "disrespectful". Market expectations for the progress of the peace agreement have cooled significantly, and safe-haven demand has surged.
Uncertainty in the Middle East: There are still differences in the Iran nuclear agreement negotiations. Although Trump said it was "close to being reached", internal news in Iran showed that key issues have not been resolved and the risk of geopolitical conflict continues.
Trade situation and long-term support factors
The pressure of easing tariffs between China and the United States has been exhausted: Although the China-US tariff agreement has eased trade frictions in the short term, the market's focus has shifted to economic data and subsequent policy impacts. In the long run, global central banks continue to buy gold (more than 1,000 tons of gold in 2024), stagflation risks (high inflation and low growth coexist) and weakening US dollar credit still support gold.
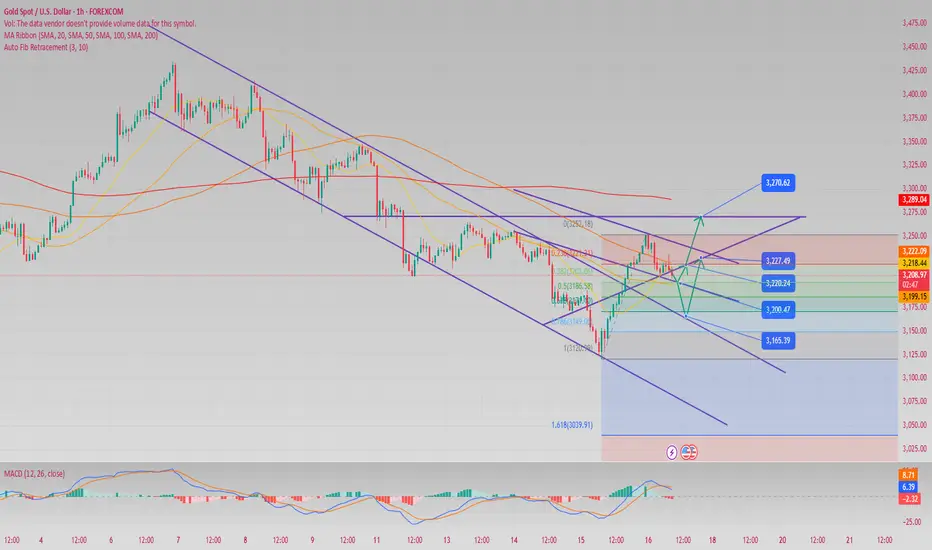
2. Key technical points
Support level:
Short-term: US$3205-3210 (psychological barrier and 4-hour Bollinger band middle track).
Medium term: $3160 (trend line support and 60-day moving average).
Resistance level:
Above: $3260-3270 (high pressure zone 4 hours ago).
Long-term target: $3330-3350 (gap filling and historical high range).
Technical signal:
Daily MACD bottom divergence, RSI rebounded from the oversold area, indicating strong short-term rebound momentum.
If it breaks through the $3260 resistance, it may start a new round of rise; if it falls below $3200, it may fall back to the $3160 support.
3. Optimal trading strategy
Short-term operation (intraday to intraweek)
Long opportunity:
Entry conditions: Gold price pulls back to the $3205-3210 range to stabilize, or the US dollar index does not break through the 100.50 resistance.
Target: $3260-3280, stop loss set below 3180.
Short opportunities:
Entry conditions: Gold price rebounds to 3260-3280 range and encounters resistance, or the US dollar index stabilizes at 101.
Target: 3220-3200 US dollars, stop loss set above 3290.
Medium-term strategy (monthly level)
Bullish logic: Central bank gold demand, stagflation risk and normalization of geopolitical conflicts support long-term upward trend.
Entry time: If gold price falls back to 3160-3180 area without breaking, long positions can be opened in batches, stop loss 3130, target 3330-3350 US dollars.
Risk control points
Strict stop loss: short-term stop loss does not exceed 2% of the total position, medium-term stop loss does not exceed 5%.
Event avoidance: Pay attention to today's Michigan Consumer Confidence Index and import price data in the United States, and reduce positions before the data is released.
IV. Summary and risk warning
Core contradiction: Short-term economic data and geopolitical risks dominate fluctuations, and medium- and long-term structural benefits remain unchanged.
Potential risks:
Policy changes: If the Fed releases hawkish signals or Russia-Ukraine negotiations make unexpected progress, it may trigger a sharp correction.
Technical overbought repair: Gold has risen too much in the short term, so we need to be wary of profit-taking pressure.
Operation principles: light positions, strict stop losses, and give priority to the breakthrough direction of the 3200-3260 US dollar range, and follow the trend.
Trade active
After gold effectively fell below the key support level of $3,200/ounce this week, the technical pattern showed a continued downward trend. The theoretical downward target can be temporarily observed in the $2,900/ounce area. Although the price rebounded temporarily near $3,120/ounce and hit $3,252/ounce, the current rebound should still be characterized as a technical correction rather than a trend reversal. Since May 9, technical analysis has continued to emphasize $3,500/ounce as an important top reference level, and has built a short-selling strategy framework based on this. Although price fluctuations have experienced multiple shocks during this period, the staged support and resistance effects have been verified by the market. The current price rebound in the 3160 area must strictly follow the principle of interval operation, and maintain a trend bearish stance before the fundamental driving factors have fundamentally changed.
From the gold 30-minute K-line chart, it can be seen that the K-line relies on the 5-day moving average to rise continuously. Today's gold market fell relatively strongly, but the MACD shrank, and the short-term may be corrected. In terms of operation, it seems that the negative line is going down all the way. In the future, the gold price will rebound. At least at the daily level, the K-line is still a bullish trend. In summary, it is recommended to buy gold in the short-term correction today, and short gold in the rebound.
Operation strategy:
1. It is recommended to buy gold in the correction area of 3165-3170, with a stop loss at 3157 and a target of 3180-3200
2. It is recommended to short gold in the rebound area of 3200-3205, with a stop loss at 3213 and a target of 3190-3180
Related publications
Disclaimer
The information and publications are not meant to be, and do not constitute, financial, investment, trading, or other types of advice or recommendations supplied or endorsed by TradingView. Read more in the Terms of Use.
Related publications
Disclaimer
The information and publications are not meant to be, and do not constitute, financial, investment, trading, or other types of advice or recommendations supplied or endorsed by TradingView. Read more in the Terms of Use.