Key Concepts on the Chart
Market Sessions Highlighted (Tokyo):
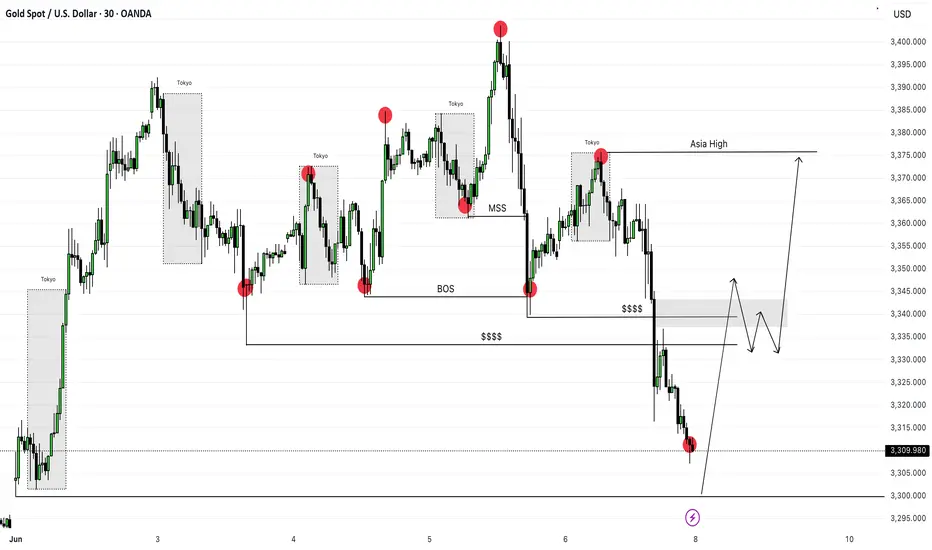
• Grey boxes represent the Tokyo trading session, a time often used to identify liquidity and manipulation zones.
• These zones are often swept during the London or New York sessions.
Structure Points with Red Dots:
• These indicate significant swing highs and lows, used to define market structure and changes in trend.
BOS (Break of Structure):
• Marked around the middle of the chart.
• Indicates that price broke below a previous low, shifting from bullish to bearish structure.
MSS (Market Structure Shift):
• Located before the BOS.
• Signifies an early warning that the bullish structure was weakening.
Liquidity Zones ($$$$):
• These areas mark liquidity pools, where many stop-losses or pending orders are likely resting.
• The market often targets these zones before reversing.
6. Price Action Forecast (Right side of the chart):
• Current price is at a liquidity sweep low (~3309.980).
• Forecast shows a potential bullish reversal from this liquidity grab zone.
• Price is projected to rally back into the gray supply zone (~3340–3345) for a possible mitigation.
• Then, it may retrace before pushing higher to take out the “Asia High” (~3375).
Bullish Bias Justification
• Liquidity Grab at the recent low could fuel a reversal.
• Previous supply zones may act as mitigation points for a retracement.
• Targeting the Asian session high fits a typical smart money play: grab liquidity below, then reverse and run buy-side liquidity.
Overall Interpretation
• The analyst expects a bullish move after the liquidity sweep at the lows.
• A classic smart money reversal setup is forming: BOS → retracement → liquidity sweep → reversal targeting equal highs/liquidity above.
Market Sessions Highlighted (Tokyo):
• Grey boxes represent the Tokyo trading session, a time often used to identify liquidity and manipulation zones.
• These zones are often swept during the London or New York sessions.
Structure Points with Red Dots:
• These indicate significant swing highs and lows, used to define market structure and changes in trend.
BOS (Break of Structure):
• Marked around the middle of the chart.
• Indicates that price broke below a previous low, shifting from bullish to bearish structure.
MSS (Market Structure Shift):
• Located before the BOS.
• Signifies an early warning that the bullish structure was weakening.
Liquidity Zones ($$$$):
• These areas mark liquidity pools, where many stop-losses or pending orders are likely resting.
• The market often targets these zones before reversing.
6. Price Action Forecast (Right side of the chart):
• Current price is at a liquidity sweep low (~3309.980).
• Forecast shows a potential bullish reversal from this liquidity grab zone.
• Price is projected to rally back into the gray supply zone (~3340–3345) for a possible mitigation.
• Then, it may retrace before pushing higher to take out the “Asia High” (~3375).
Bullish Bias Justification
• Liquidity Grab at the recent low could fuel a reversal.
• Previous supply zones may act as mitigation points for a retracement.
• Targeting the Asian session high fits a typical smart money play: grab liquidity below, then reverse and run buy-side liquidity.
Overall Interpretation
• The analyst expects a bullish move after the liquidity sweep at the lows.
• A classic smart money reversal setup is forming: BOS → retracement → liquidity sweep → reversal targeting equal highs/liquidity above.
Disclaimer
The information and publications are not meant to be, and do not constitute, financial, investment, trading, or other types of advice or recommendations supplied or endorsed by TradingView. Read more in the Terms of Use.
Disclaimer
The information and publications are not meant to be, and do not constitute, financial, investment, trading, or other types of advice or recommendations supplied or endorsed by TradingView. Read more in the Terms of Use.