Dear Traders,
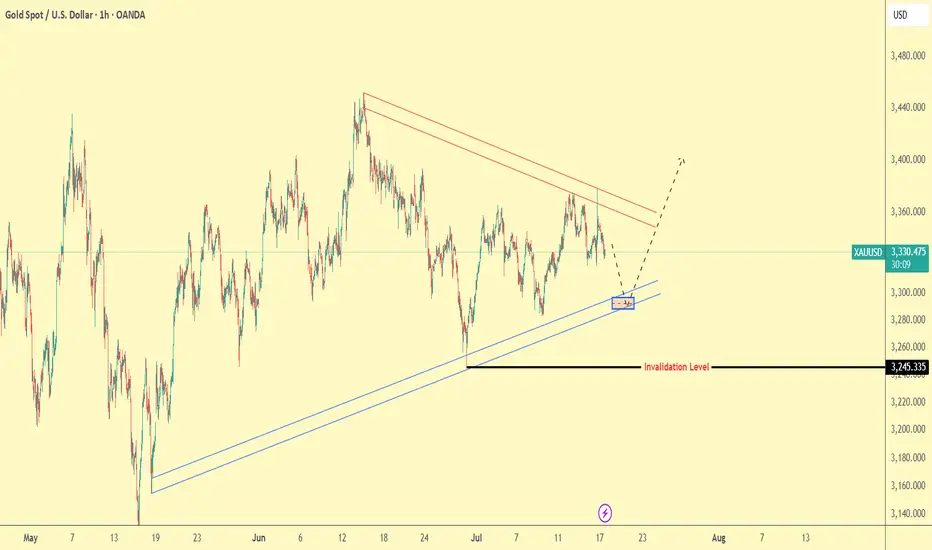
The chart shows that XAU/USD is currently trading near the bottom of a long-term ascending channel (blue lines). At the same time, a descending triangle pattern (red lines) indicates bearish pressure.
🔹 Price is around $3,331, and a strong support zone near $3,285–$3,290 is highlighted. This area could serve as a launch point for a bullish reaction.
🔹 If price bounces here, the expected move could aim for the upper triangle resistance zone around $3,380–$3,390.
🔹 The invalidation level is at $3,245. A break below this level would negate the bullish scenario and potentially lead to further decline.
📌 Summary:
Key support: $3,285–$3,290
Bullish target: $3,380–$3,390
Invalidation level: $3,245
Regards,
Alireza!
💰MY FREE FOREX CRYPTO SIGNALS TELEGRAM CHANNEL: : t.me/Alirezaktrade
Disclaimer
The information and publications are not meant to be, and do not constitute, financial, investment, trading, or other types of advice or recommendations supplied or endorsed by TradingView. Read more in the Terms of Use.