Dear Traders,
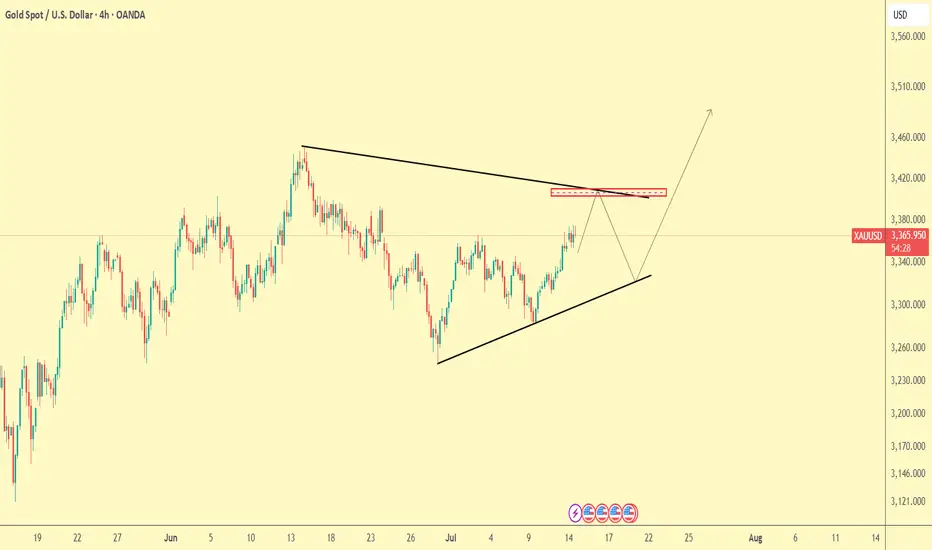
On the 4H chart, gold (XAUUSD) is forming a symmetrical triangle, with price approaching a key resistance zone (highlighted in red) around 3375 - 3385, which aligns with the descending trendline.
📍 Two possible scenarios:
Pullback scenario (more likely short-term):
Price gets rejected from the red box and pulls back to the ascending trendline below (~3300-3320).
Bullish breakout scenario:
If price breaks and holds above the red resistance and descending trendline, the next bullish target could be 3450 - 3470.
For now, the best strategy: Wait for price reaction at resistance before entering a trade.
Regards,
Alireza!
💰MY FREE FOREX CRYPTO SIGNALS TELEGRAM CHANNEL: : t.me/Alirezaktrade
Disclaimer
The information and publications are not meant to be, and do not constitute, financial, investment, trading, or other types of advice or recommendations supplied or endorsed by TradingView. Read more in the Terms of Use.