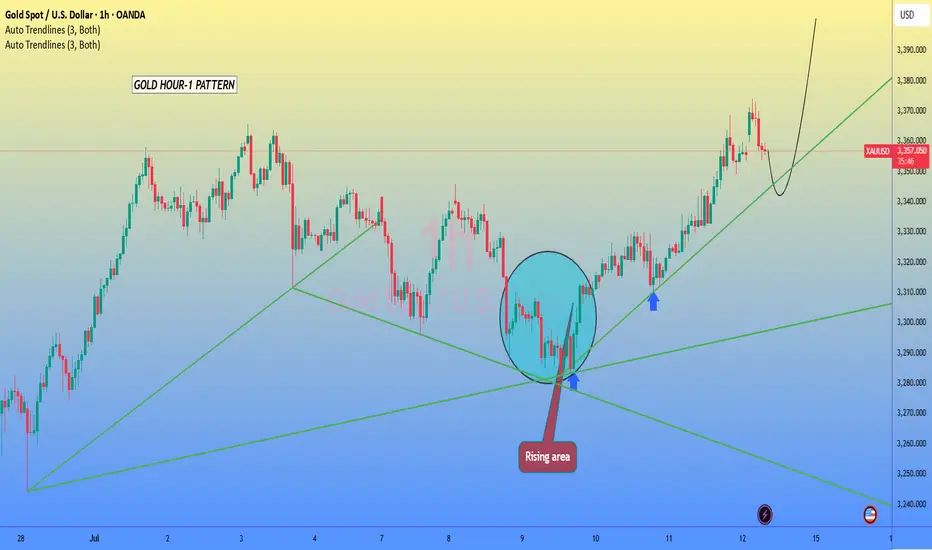
The chart I've provided for XAU/USD (Gold) on the 1-hour timeframe shows a bullish trend continuation pattern forming after a previous correction.
Key Observations:
1. Rising Trendline Support:
Price is respecting a major upward trendline.
The recent dip is projected to retest the trendline (around the 3,345–3,350 area) before bouncing up again.
2. Bullish Reversal Zone (Rising Area):
Highlighted zone where price previously reversed from a low.
This area (circled) acted as a strong demand zone, leading to the recent bullish rally.
3. Price Projection (Black Curve):
There is a drawn projection showing a pullback to the trendline, followed by a continuation to the upside, possibly targeting 3,390 or higher.
Trade Plan (Based on This Pattern):
✅ Buy Opportunity:
Entry Zone: 3,345 – 3,350 (if price retests the trendline support)
Stop Loss: Below 3,320 (just under the trendline to avoid false breakouts)
Take Profits:
TP1: 3,370 (minor resistance)
TP2: 3,380
TP3: 3,390–3,400 (upper target from the projection)
If the price breaks below 3,335 with strong volume, it may invalidate this bullish pattern. But as long as it respects the rising trendline, the bias remains bullish.
Trade active
Active. Hold on towards buy side.JOIN FREE SIGNALS TELEGRAM
t.me/forexsupppar1
FOREX MARKET ANALYSIS AND IDEAS
8 YEARS EXPERIENCE IN THIS FIELD
t.me/forexsupppar1
FOREX MARKET ANALYSIS AND IDEAS
8 YEARS EXPERIENCE IN THIS FIELD
Disclaimer
The information and publications are not meant to be, and do not constitute, financial, investment, trading, or other types of advice or recommendations supplied or endorsed by TradingView. Read more in the Terms of Use.
JOIN FREE SIGNALS TELEGRAM
t.me/forexsupppar1
FOREX MARKET ANALYSIS AND IDEAS
8 YEARS EXPERIENCE IN THIS FIELD
t.me/forexsupppar1
FOREX MARKET ANALYSIS AND IDEAS
8 YEARS EXPERIENCE IN THIS FIELD
Disclaimer
The information and publications are not meant to be, and do not constitute, financial, investment, trading, or other types of advice or recommendations supplied or endorsed by TradingView. Read more in the Terms of Use.