What I do:
Firstly, I took an ATR to check average move on the market in last 120 candle on H1 to see what is the average for the market to move in one weeks. I take that number and increase it with current price level and make it as a target of what I think the price will respect.
I take ROC to check average move on previous week only. From 1 to 120 time-period based on sequences of the candle. That's the number that will be used in the Diminishing Rates Graph.
Quick Recap:
Market this week create a upside move. I'll say this move show buyer are trying to invade seller's territory while seller are trying to defend it. I wanted to see how seller's determination will affect the performances of the buyer on how they move the market to upside.
Analysis:
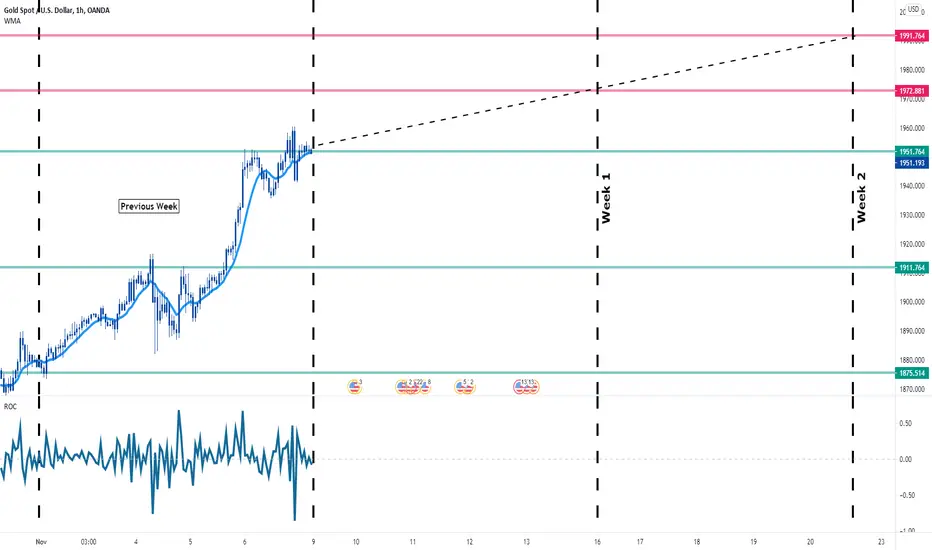
As you can see in the graph, the diminishing graph started to move after the buyer create an impulses to upside at the middle of the week. However, the buyer cannot hold their performances as I expected as the seller are more determined to defend their key level so that they won't be violated anymore.
In terms of phases, what I can see that is buyer are still trying to push the price higher but they couldn't. Maybe the phases is near to their end. This is because the graph is increasing.
In terms of directions, the price might go to 1991.764 key level after 347 attemps only and only if the buyer keep their performances. That's why I expect the market will consolidate between 1972.881 with current price level on upside. However, if the buyer increase their performances, they would have likely going to push the price higher than expected.
Check out the graph I studied here:
i.imgur.com/EE3serM.png
Firstly, I took an ATR to check average move on the market in last 120 candle on H1 to see what is the average for the market to move in one weeks. I take that number and increase it with current price level and make it as a target of what I think the price will respect.
I take ROC to check average move on previous week only. From 1 to 120 time-period based on sequences of the candle. That's the number that will be used in the Diminishing Rates Graph.
Quick Recap:
Market this week create a upside move. I'll say this move show buyer are trying to invade seller's territory while seller are trying to defend it. I wanted to see how seller's determination will affect the performances of the buyer on how they move the market to upside.
Analysis:
As you can see in the graph, the diminishing graph started to move after the buyer create an impulses to upside at the middle of the week. However, the buyer cannot hold their performances as I expected as the seller are more determined to defend their key level so that they won't be violated anymore.
In terms of phases, what I can see that is buyer are still trying to push the price higher but they couldn't. Maybe the phases is near to their end. This is because the graph is increasing.
In terms of directions, the price might go to 1991.764 key level after 347 attemps only and only if the buyer keep their performances. That's why I expect the market will consolidate between 1972.881 with current price level on upside. However, if the buyer increase their performances, they would have likely going to push the price higher than expected.
Check out the graph I studied here:
i.imgur.com/EE3serM.png
Disclaimer
The information and publications are not meant to be, and do not constitute, financial, investment, trading, or other types of advice or recommendations supplied or endorsed by TradingView. Read more in the Terms of Use.
Disclaimer
The information and publications are not meant to be, and do not constitute, financial, investment, trading, or other types of advice or recommendations supplied or endorsed by TradingView. Read more in the Terms of Use.