✅ Summary of Previous Forecast Outcome (Short-Term Frame)
Asset: Gold (XAUUSD)
Venue: OANDA
Distribution Cycle: 4 - Level Forecast (Short-Term)
Successfully Achieved Levels:
✅ Level 1: $3,429.196
✅ Level 2: $3,480.250
These two levels were met precisely, validating our proprietary model’s accuracy on the short - term timeframe.
🔄 Updated Forecast: Longer Timeframe Distribution Cycle
With bullish support confirmed, the model transitions to a higher timeframe, initiating a new distribution sequence reflecting broader market participation and higher price expansion.
🔹 Three Stages Identified:
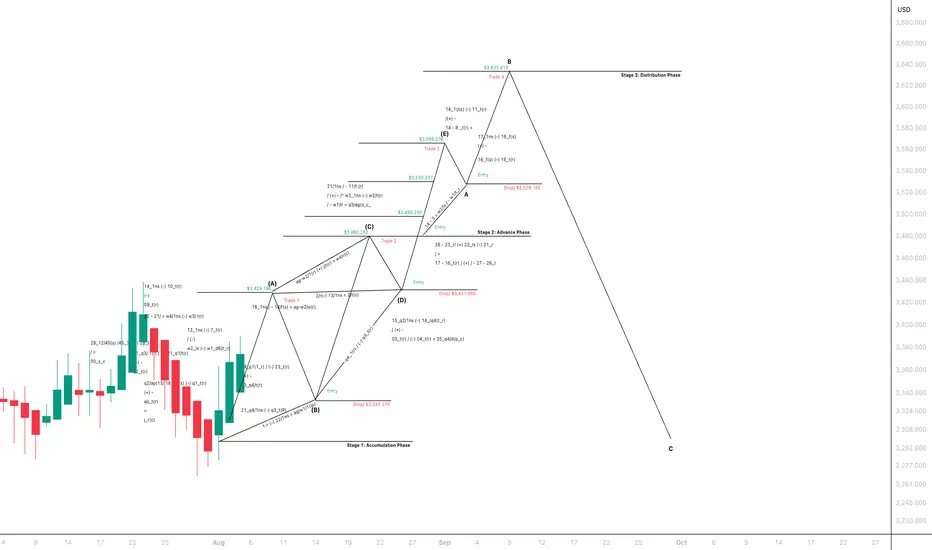
Stage 1: Accumulation Phase
• Support held around $3,333.379 (Drop) → bullish reversal from this point confirms base structure.
• Key Entry Point: After low B in Accumulation
2. Stage 2: Advance Phase
Multiple key levels achieved within this impulsive leg:
• $3,498.250 (Level 3)
• $3,530.237 (Level 4)
• $3,566.076 (Level 5)
• Retested support at $3,431.665, offering a re-entry before next expansion
3. Stage 3: Distribution Phase
• Final Distribution Level (Level 6): $3,633.419 (marked as Point B on chart)
• Projection for exhaustion/decline from this level follows typical distribution pattern
• Final drop target (C) is not numerically shown but implies a significant corrective wave.
📌 Distribution Levels: Current Forecast (High Timeframe)
Level 1: $3,429.196
Level 2:$3,480.250
Level 3: $3,498.250
Level 4: $3,566.076
Level 5: $3,633.650
🧠 Model Insights
• The forecast retains a fractal distribution structure with:
• High precision across levels
• Distinct entry zones with confirmed support validation
• Each wave expansion adheres to the model’s rules shown on the chart
• A corrective leg is anticipated after final distribution, marked as Point C
🟢 Conclusion
• The model has successfully transitioned from a short-term distribution cycle to a higher timeframe with confirmed bullish structure.
• Next target zone is $3,633.419, marking the final distribution level before expected reversal.
• The chart structure, drop levels, and entries reflect a complete cycle consistent with institutional-grade market behaviour.
I’ll continue publishing live cycle forecasts across key assets - built with institutional discipline and retail accessibility.
Disclaimer:
The following forecast is derived from a proprietary, hand-crafted mathematical model developed independently over several years.
It does not rely on traditional indicators, technical patterns, or third-party frameworks such as Elliott Wave Theory. This model calculates price action based on distribution phases, economic timing cycles, and natural market imbalances.
#(GOLD) #MarketForecast #DistributionCycle #TradingModel #QuantitativeAnalysis #InstitutionalTrading #Stage3Distribution #AssetManagement #TradingStrategy #SymmetryInMarkets #ForecastAccuracy

Asset: Gold (XAUUSD)
Venue: OANDA
Distribution Cycle: 4 - Level Forecast (Short-Term)
Successfully Achieved Levels:
✅ Level 1: $3,429.196
✅ Level 2: $3,480.250
These two levels were met precisely, validating our proprietary model’s accuracy on the short - term timeframe.
🔄 Updated Forecast: Longer Timeframe Distribution Cycle
With bullish support confirmed, the model transitions to a higher timeframe, initiating a new distribution sequence reflecting broader market participation and higher price expansion.
🔹 Three Stages Identified:
Stage 1: Accumulation Phase
• Support held around $3,333.379 (Drop) → bullish reversal from this point confirms base structure.
• Key Entry Point: After low B in Accumulation
2. Stage 2: Advance Phase
Multiple key levels achieved within this impulsive leg:
• $3,498.250 (Level 3)
• $3,530.237 (Level 4)
• $3,566.076 (Level 5)
• Retested support at $3,431.665, offering a re-entry before next expansion
3. Stage 3: Distribution Phase
• Final Distribution Level (Level 6): $3,633.419 (marked as Point B on chart)
• Projection for exhaustion/decline from this level follows typical distribution pattern
• Final drop target (C) is not numerically shown but implies a significant corrective wave.
📌 Distribution Levels: Current Forecast (High Timeframe)
Level 1: $3,429.196
Level 2:$3,480.250
Level 3: $3,498.250
Level 4: $3,566.076
Level 5: $3,633.650
🧠 Model Insights
• The forecast retains a fractal distribution structure with:
• High precision across levels
• Distinct entry zones with confirmed support validation
• Each wave expansion adheres to the model’s rules shown on the chart
• A corrective leg is anticipated after final distribution, marked as Point C
🟢 Conclusion
• The model has successfully transitioned from a short-term distribution cycle to a higher timeframe with confirmed bullish structure.
• Next target zone is $3,633.419, marking the final distribution level before expected reversal.
• The chart structure, drop levels, and entries reflect a complete cycle consistent with institutional-grade market behaviour.
I’ll continue publishing live cycle forecasts across key assets - built with institutional discipline and retail accessibility.
Disclaimer:
The following forecast is derived from a proprietary, hand-crafted mathematical model developed independently over several years.
It does not rely on traditional indicators, technical patterns, or third-party frameworks such as Elliott Wave Theory. This model calculates price action based on distribution phases, economic timing cycles, and natural market imbalances.
#(GOLD) #MarketForecast #DistributionCycle #TradingModel #QuantitativeAnalysis #InstitutionalTrading #Stage3Distribution #AssetManagement #TradingStrategy #SymmetryInMarkets #ForecastAccuracy
Institutional Note:
For institutional review, independent verification, or strategic collaboration:
institutions@bmoses.com.au
For institutional review, independent verification, or strategic collaboration:
institutions@bmoses.com.au
Disclaimer
The information and publications are not meant to be, and do not constitute, financial, investment, trading, or other types of advice or recommendations supplied or endorsed by TradingView. Read more in the Terms of Use.