The rebound momentum of the gold market has been significantly enhanced today. After breaking through the 3345 resistance in the Asian session, it has continued to rise. It has now reached around 3360, and has rebounded by more than US$50 from this week's low of 3310, setting a new rebound high in the past three trading days. After the gold price effectively broke through the key resistance band of 3340–3350, it triggered some short stop loss trading and trend funds to enter the market, driving the price to accelerate the upward trend. Judging from the hourly chart, the trading volume has increased by about 30% compared with the same period yesterday, indicating that the market's recognition of this round of rebound has increased significantly.
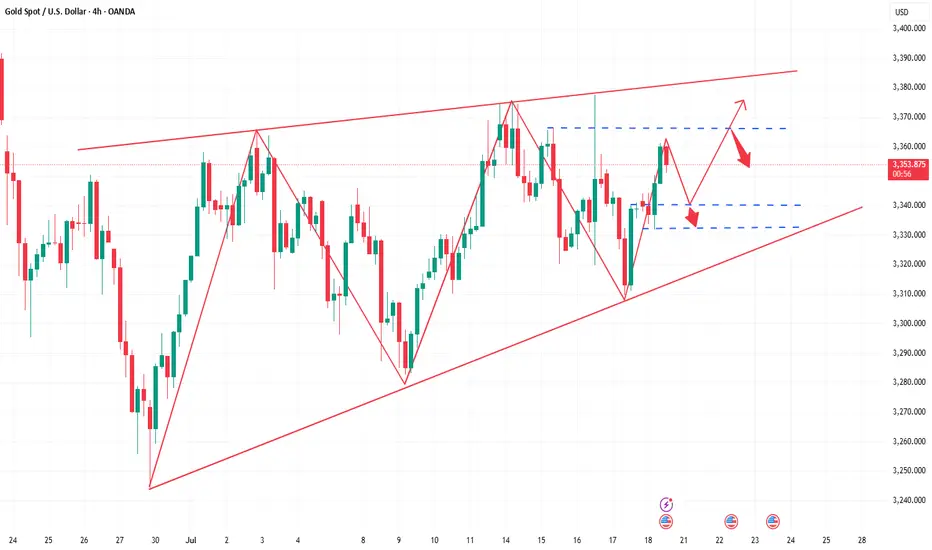
A physically full sun candle chart has been closed in the 4-hour cycle, successfully standing on the Bollinger middle track, further confirming the upward structure, the mid-track support area 3340–3345 has become a key position for bulls' defense, and the short-term structure of the market is still relatively strong. Overall, the intraday retracement range of gold is limited, and the probability of continuing to rise is relatively high. In terms of strategy, it is still recommended to go long. In the short term, focus on the 3340–3345 area retracement support, and the stop-profit target is 3365–3370; if the upward breakthrough, pay attention to the suppression performance of the 3370–3375 line, beware of highs and falls, and pay attention to controlling risks.
A physically full sun candle chart has been closed in the 4-hour cycle, successfully standing on the Bollinger middle track, further confirming the upward structure, the mid-track support area 3340–3345 has become a key position for bulls' defense, and the short-term structure of the market is still relatively strong. Overall, the intraday retracement range of gold is limited, and the probability of continuing to rise is relatively high. In terms of strategy, it is still recommended to go long. In the short term, focus on the 3340–3345 area retracement support, and the stop-profit target is 3365–3370; if the upward breakthrough, pay attention to the suppression performance of the 3370–3375 line, beware of highs and falls, and pay attention to controlling risks.
Trade active
This week, the trading rhythm is clear, the market trend is accurate, the trading plan is strictly implemented, the key bands are steady and steady, and the overall performance is stable and orderly. Congratulations to the brothers who firmly implemented the plan and reaped good returns. Plan trading, execution is king. The whole process is driven by the main structure + emotional rhythm. Refuse to chase high and sell low, and only make high-win operations after confirmation. Trading is not about frequent operations, but about seeing, doing right, and holding steady. The direction is not difficult, but the difficulty is concentration and patience. The rhythm is not fast, but the fast is emotion and impulse. Next week, continue to plan first, seek victory in stability, maintain a consistent rhythm, and take one step at a time.Trade closed: target reached
The overall performance of the gold market this week was stable, like a deep stream in still water. The price fluctuation did not exceed 70 US dollars, and the weekly line finally ended with a negative cross star pattern. This pattern is like a brief stalemate between long and short parties on the chessboard, suggesting that at the current price, the power of buyers and sellers is balanced, and the market is in a wait-and-see mood, waiting for new catalysts to break this balance. From the monthly level, the gold price is still trapped in a wide range, as if bound by invisible shackles, and has not yet shown any clear trend breakthrough signs. Long and short parties are still accumulating strength in secret.Looking back at this week's market, gold fluctuated repeatedly in the range of 3377-3309, facing strong resistance pressure in the 3360-3375 area above. After rising to this area on Friday, it was like a deflated ball, and it fell under pressure; the short-term support below continued to focus on the vicinity of 3340-3345, and the focus was on the 3330 line to obtain strong support. Many downward explorations failed to effectively break through, showing the strength of this support level. Technically, the alternating yin and yang candlestick patterns on the daily chart further confirm the current oscillating pattern. However, the gains and losses of the 3330 line are crucial. If this support is lost, the bears may take the lead; if it can be held, I think the bulls may still have the potential to accumulate momentum to attack, and the breakthrough of the 3375 line will become the start of a trend of bullish rise.
I treat every partner with my best efforts. I do not promise huge profits, but only pursue replicable and stable profits. Many people are already on this path, and you can too.Free witness telegram group t.me/TP_Daniel1
Related publications
Disclaimer
The information and publications are not meant to be, and do not constitute, financial, investment, trading, or other types of advice or recommendations supplied or endorsed by TradingView. Read more in the Terms of Use.