📊
________________________________________
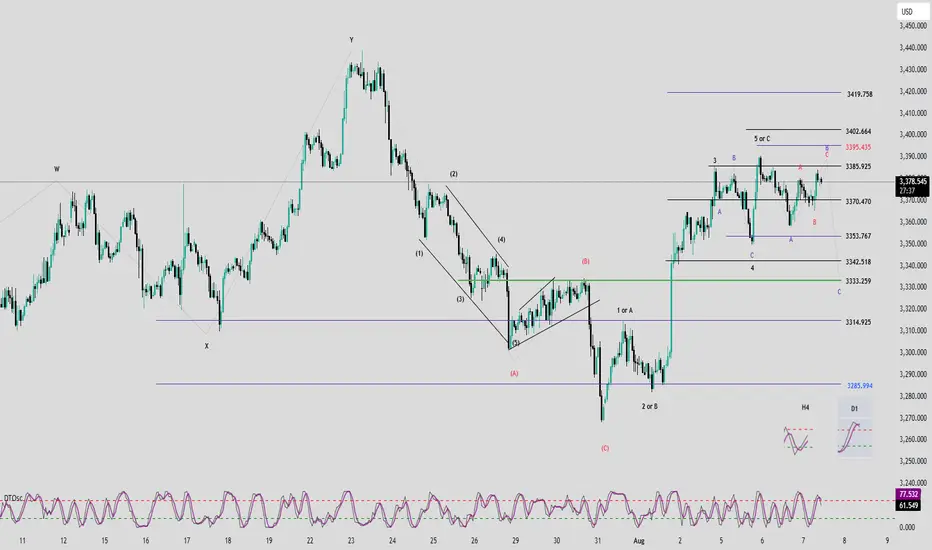
🔍 Momentum Analysis:
• D1 Timeframe: Daily momentum is turning bearish, signaling that a medium-term downtrend may have already started and could last until mid-next week.
• H4 Timeframe: Momentum is rising, but the slope of the two momentum lines is relatively flat → indicating weak bullish strength. We should closely watch the overhead resistance zones.
• H1 Timeframe: Momentum has entered the overbought zone → a short-term reversal is likely, especially near the 3386 level.
________________________________________
🌀 Elliott Wave Structure:
• Based on the bearish momentum shift on the D1 chart, we expect the market is entering an ABC corrective pattern (in green).
• Currently:
o Wave A is completed.
o Wave B is in progress.
• Since Wave A appears to be a 3-wave structure, Wave B may unfold as a flat correction. In that case, potential target zones for Wave B are:
o 3385
o or 3395 → these are the key resistance levels to monitor.
• Within Wave B (green), we observe an internal 3-wave ABC structure (in red), where:
o Wave C (red) may reach:
3386
or extend toward 3395
→ In alignment with the D1 momentum signal, 3386 is considered a potential entry point for a short position.
________________________________________
📈 Trade Plan:
• SELL Zone: 3386 – 3389
• Stop Loss: 3397
• Take Profits:
o TP1: 3370
o TP2: 3353
o TP3: 3333
________________________________________
🔍 Momentum Analysis:
• D1 Timeframe: Daily momentum is turning bearish, signaling that a medium-term downtrend may have already started and could last until mid-next week.
• H4 Timeframe: Momentum is rising, but the slope of the two momentum lines is relatively flat → indicating weak bullish strength. We should closely watch the overhead resistance zones.
• H1 Timeframe: Momentum has entered the overbought zone → a short-term reversal is likely, especially near the 3386 level.
________________________________________
🌀 Elliott Wave Structure:
• Based on the bearish momentum shift on the D1 chart, we expect the market is entering an ABC corrective pattern (in green).
• Currently:
o Wave A is completed.
o Wave B is in progress.
• Since Wave A appears to be a 3-wave structure, Wave B may unfold as a flat correction. In that case, potential target zones for Wave B are:
o 3385
o or 3395 → these are the key resistance levels to monitor.
• Within Wave B (green), we observe an internal 3-wave ABC structure (in red), where:
o Wave C (red) may reach:
3386
or extend toward 3395
→ In alignment with the D1 momentum signal, 3386 is considered a potential entry point for a short position.
________________________________________
📈 Trade Plan:
• SELL Zone: 3386 – 3389
• Stop Loss: 3397
• Take Profits:
o TP1: 3370
o TP2: 3353
o TP3: 3333
👉 Join the channel to receive more scalping signals!
Channel Telegram: t.me/+XkFQ95yHVOEwNDc1
Channel Telegram: t.me/+XkFQ95yHVOEwNDc1
Related publications
Disclaimer
The information and publications are not meant to be, and do not constitute, financial, investment, trading, or other types of advice or recommendations supplied or endorsed by TradingView. Read more in the Terms of Use.