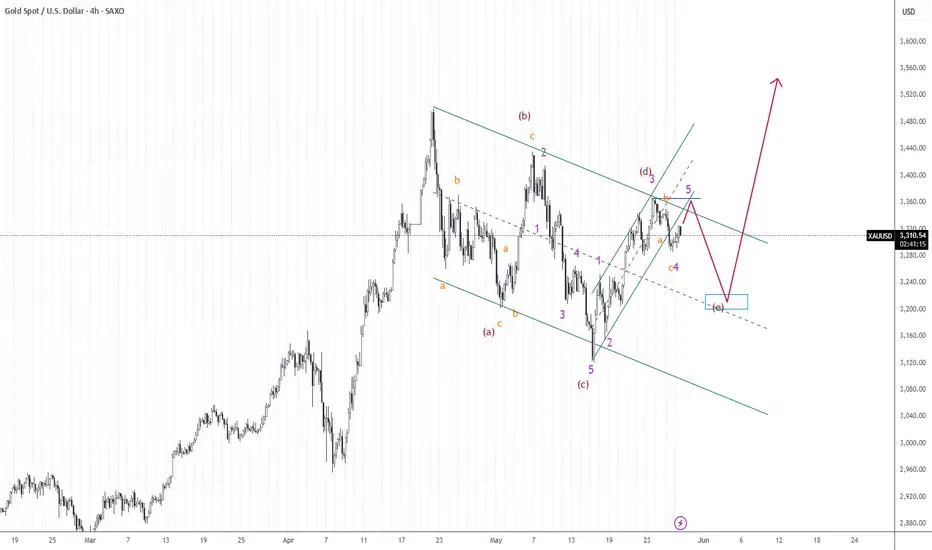
The chart for XAU/USD (Gold Spot vs. USD) on the 4-hour timeframe displays a potential Elliott Wave structure within a descending channel. The price recently completed a five-wave impulsive move upward, labeled as wave (d), suggesting a corrective move down to complete wave (e). A potential short-term entry point is identified near the top of the rising wedge at **\$3,360**, targeting a bearish pullback. The expected retracement may reach the **\$3,240–\$3,200** zone, where the (e) wave is projected to complete. This area aligns with the lower boundary of the corrective channel and prior structural support. After this correction, a bullish reversal is anticipated, potentially launching a strong rally towards **\$3,520+**, which serves as the long-term **take profit** zone. This setup presents an opportunity for traders to position short in the near term and long once the (e) wave completes, signaling the end of the larger correction and the start of a bullish breakout.
Disclaimer
The information and publications are not meant to be, and do not constitute, financial, investment, trading, or other types of advice or recommendations supplied or endorsed by TradingView. Read more in the Terms of Use.
Disclaimer
The information and publications are not meant to be, and do not constitute, financial, investment, trading, or other types of advice or recommendations supplied or endorsed by TradingView. Read more in the Terms of Use.