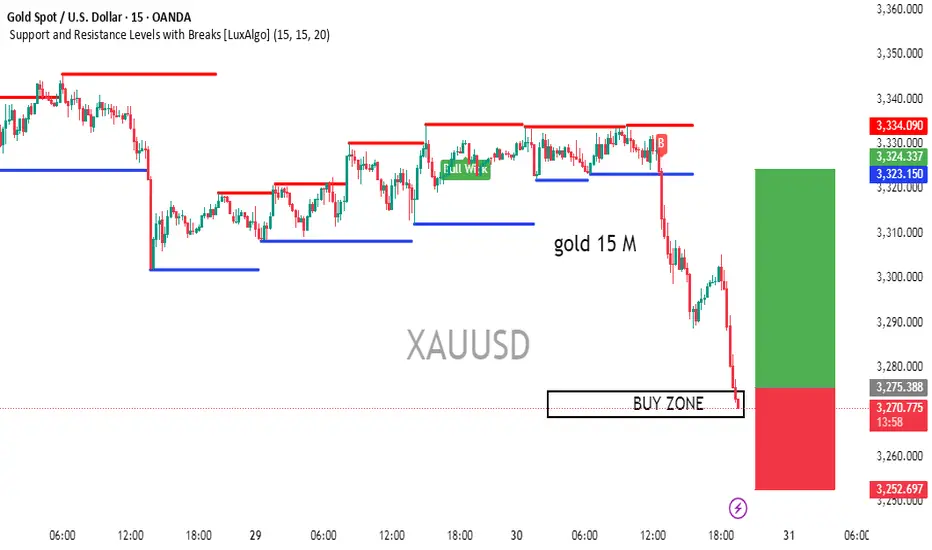
Chart: The chart displays the price of gold over time, with a red line showing a decline Annotations BUY ZONE" is written in a box below the chart.Target: 48.949 (1.49%) 4,894.9, Amount" is displayed above the green bar.Open P/L: -0.198, Qty: 11 Risk/Reward Ratio: 2.16" is shown above the red bar.Stop: 22.691 (0.69%) 2,269.1, Amount" is written below the red bar. Indicators: A blue line is visible on the chart, possibly representing a moving average or other technical indicator. A red line is also present, which may indicate a resistance level or other significant price point.
Trade active
target achievedDisclaimer
The information and publications are not meant to be, and do not constitute, financial, investment, trading, or other types of advice or recommendations supplied or endorsed by TradingView. Read more in the Terms of Use.
Disclaimer
The information and publications are not meant to be, and do not constitute, financial, investment, trading, or other types of advice or recommendations supplied or endorsed by TradingView. Read more in the Terms of Use.