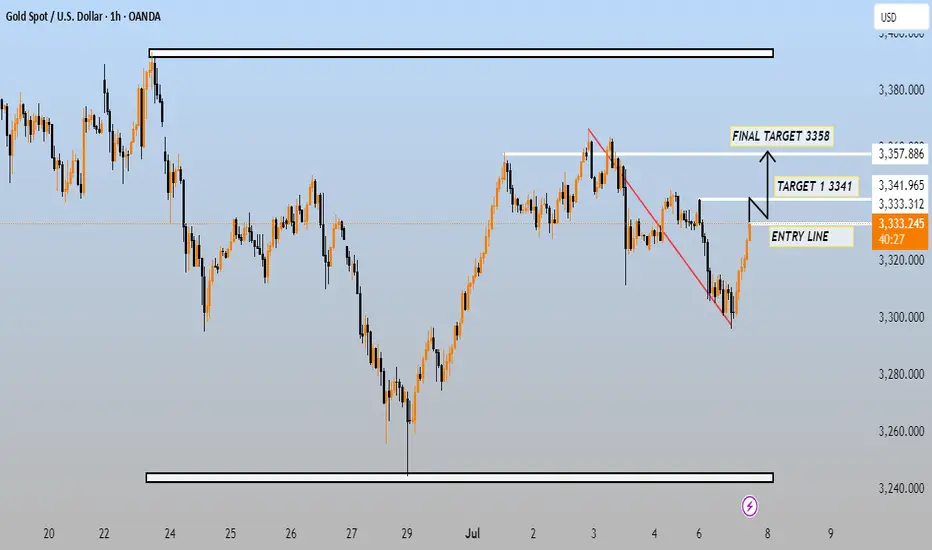
This chart represents the Gold Spot vs U.S. Dollar (XAU/USD) on the 1-hour timeframe using data from OANDA, dated July 7, 2025. It appears to be a trade setup focusing on a bullish reversal after a downtrend. Here's a breakdown of the key elements:
---
Key Technical Details:
Entry Line: Marked just above $3,331 (current price is $3,331.425).
Target 1: $3,341 – likely a resistance level or prior high.
Final Target: $3,358 – a more extended take profit level.
Trendline Break: A red descending trendline has been broken, suggesting a potential trend reversal or breakout.
Support Zone: Around $3,300 (where the price reversed), acting as a strong support level.
---
Possible Trade Idea:
Entry Point: Around the current price near $3,331.
Target 1: $3,341 (scalp or partial take-profit).
Final Target: $3,358 (swing target).
Stop Loss: Likely just below recent lows (e.g., under $3,310) – not shown but recommended.
---
Interpretation:
This is a bullish breakout trade.
The breakout above the descending trendline adds confirmation.
Targets are aligned with prior resistance levels.
Risk-reward is potentially favorable if entered near the breakout level.
Let me know if you'd like help calculating the exact position sizing or risk/reward ratio based on your stop loss.
---
Key Technical Details:
Entry Line: Marked just above $3,331 (current price is $3,331.425).
Target 1: $3,341 – likely a resistance level or prior high.
Final Target: $3,358 – a more extended take profit level.
Trendline Break: A red descending trendline has been broken, suggesting a potential trend reversal or breakout.
Support Zone: Around $3,300 (where the price reversed), acting as a strong support level.
---
Possible Trade Idea:
Entry Point: Around the current price near $3,331.
Target 1: $3,341 (scalp or partial take-profit).
Final Target: $3,358 (swing target).
Stop Loss: Likely just below recent lows (e.g., under $3,310) – not shown but recommended.
---
Interpretation:
This is a bullish breakout trade.
The breakout above the descending trendline adds confirmation.
Targets are aligned with prior resistance levels.
Risk-reward is potentially favorable if entered near the breakout level.
Let me know if you'd like help calculating the exact position sizing or risk/reward ratio based on your stop loss.
Trade active
TARGET 1 DONEJoin telegram free...
t.me/+16bIVCNBo0MzYzk0
Forex Gold & Crypto Signals with
detailed analysis & get consistent |
result ...
Gold Signals with peoper TP & SL for
high profit ...
t.me/+16bIVCNBo0MzYzk0
t.me/+16bIVCNBo0MzYzk0
Forex Gold & Crypto Signals with
detailed analysis & get consistent |
result ...
Gold Signals with peoper TP & SL for
high profit ...
t.me/+16bIVCNBo0MzYzk0
Disclaimer
The information and publications are not meant to be, and do not constitute, financial, investment, trading, or other types of advice or recommendations supplied or endorsed by TradingView. Read more in the Terms of Use.
Join telegram free...
t.me/+16bIVCNBo0MzYzk0
Forex Gold & Crypto Signals with
detailed analysis & get consistent |
result ...
Gold Signals with peoper TP & SL for
high profit ...
t.me/+16bIVCNBo0MzYzk0
t.me/+16bIVCNBo0MzYzk0
Forex Gold & Crypto Signals with
detailed analysis & get consistent |
result ...
Gold Signals with peoper TP & SL for
high profit ...
t.me/+16bIVCNBo0MzYzk0
Disclaimer
The information and publications are not meant to be, and do not constitute, financial, investment, trading, or other types of advice or recommendations supplied or endorsed by TradingView. Read more in the Terms of Use.