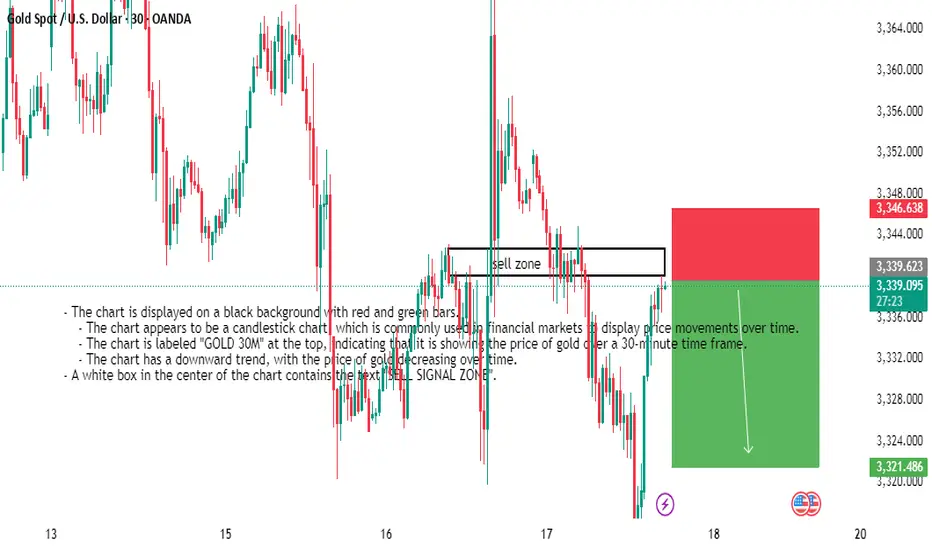
- The chart is displayed on a black background with red and green bars.
- The chart appears to be a candlestick chart, which is commonly used in financial markets to display price movements over time.
- The chart is labeled "GOLD 30M" at the top, indicating that it is showing the price of gold over a 30-minute time frame.
- The chart has a downward trend, with the price of gold decreasing over time.
- A white box in the center of the chart contains the text "SELL SIGNAL ZONE".
Trade active
Disclaimer
The information and publications are not meant to be, and do not constitute, financial, investment, trading, or other types of advice or recommendations supplied or endorsed by TradingView. Read more in the Terms of Use.
Disclaimer
The information and publications are not meant to be, and do not constitute, financial, investment, trading, or other types of advice or recommendations supplied or endorsed by TradingView. Read more in the Terms of Use.