📊
🔍 Momentum Analysis:
D1 Timeframe: Momentum continues to rise strongly. It's expected that the price will keep rising for at least two more trading days, pushing the momentum indicator into the overbought territory, reinforcing the current bullish trend.
H4 Timeframe: Momentum is showing signs of a potential bearish reversal, indicating a possible corrective pullback during Monday’s trading session.
H1 Timeframe: Momentum is strongly bullish, especially evident from the powerful upward move on Friday. Price may continue rising at the open of the Asian session, potentially creating a Gap. However, caution is advised, as this Gap could signal exhaustion.
📌 Wave Pattern Analysis:
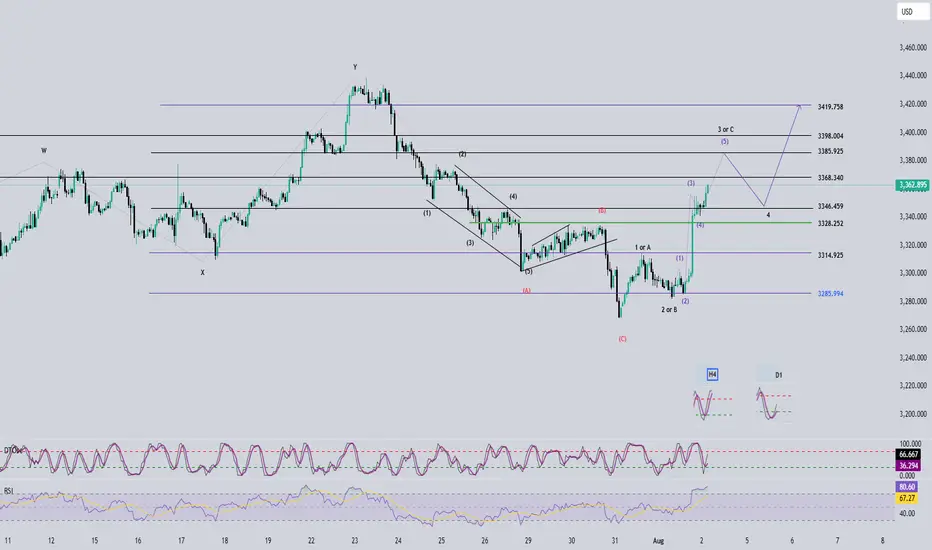
Given Friday's strong price action, the primary scenario currently favors wave 3 within the 5-wave bullish structure (12345 – black). However, we cannot entirely eliminate the possibility that this is wave C within an ABC corrective structure (black).
Presently, the price is forming a smaller 5-wave bullish structure (blue), likely in the final wave 5. Attention should be paid to two critical target zones:
🎯 Blue Wave 5 Targets:
• Target 1: 3368
• Target 2: 3385
⚠️ Next Scenario:
Upon completing the blue 5-wave structure, a corrective move downward will occur.
• If the correction does not break below 3315, the larger 5-wave bullish structure (12345 – black) is confirmed, and the price will continue upward to complete black wave 5.
• If the correction breaks below 3315, the structure shifts to an ABC corrective pattern (black), increasing the likelihood of a deeper decline to complete the larger corrective wave C (red).
🧩 Combining Momentum & Wave Analysis:
• D1 momentum strongly supports the continuation of the bullish trend.
• H4 momentum forecasts a short-term bearish correction on Monday, aligning with the formation of wave 4 correction.
• H1 momentum suggests the possibility of a Gap at Monday's Asian session open, marking the beginning of a corrective pullback as momentum reverses.
🎯 Short-term Trading Plan:
We will trade the current blue wave 5 with the following limit order plan:
✅ Sell Limit Zone: 3385 – 3387
⛔️ Stop Loss (SL): 3399
🎯 Take Profit (TP1): 3368
🎯 Take Profit (TP2): 3355
📌 Note:
The detailed trading plan for capturing the larger wave 4 correction (black) will be updated once sufficient evidence confirms the completion of the blue wave 5.
Happy trading, everyone! 🚀
🔍 Momentum Analysis:
D1 Timeframe: Momentum continues to rise strongly. It's expected that the price will keep rising for at least two more trading days, pushing the momentum indicator into the overbought territory, reinforcing the current bullish trend.
H4 Timeframe: Momentum is showing signs of a potential bearish reversal, indicating a possible corrective pullback during Monday’s trading session.
H1 Timeframe: Momentum is strongly bullish, especially evident from the powerful upward move on Friday. Price may continue rising at the open of the Asian session, potentially creating a Gap. However, caution is advised, as this Gap could signal exhaustion.
📌 Wave Pattern Analysis:
Given Friday's strong price action, the primary scenario currently favors wave 3 within the 5-wave bullish structure (12345 – black). However, we cannot entirely eliminate the possibility that this is wave C within an ABC corrective structure (black).
Presently, the price is forming a smaller 5-wave bullish structure (blue), likely in the final wave 5. Attention should be paid to two critical target zones:
🎯 Blue Wave 5 Targets:
• Target 1: 3368
• Target 2: 3385
⚠️ Next Scenario:
Upon completing the blue 5-wave structure, a corrective move downward will occur.
• If the correction does not break below 3315, the larger 5-wave bullish structure (12345 – black) is confirmed, and the price will continue upward to complete black wave 5.
• If the correction breaks below 3315, the structure shifts to an ABC corrective pattern (black), increasing the likelihood of a deeper decline to complete the larger corrective wave C (red).
🧩 Combining Momentum & Wave Analysis:
• D1 momentum strongly supports the continuation of the bullish trend.
• H4 momentum forecasts a short-term bearish correction on Monday, aligning with the formation of wave 4 correction.
• H1 momentum suggests the possibility of a Gap at Monday's Asian session open, marking the beginning of a corrective pullback as momentum reverses.
🎯 Short-term Trading Plan:
We will trade the current blue wave 5 with the following limit order plan:
✅ Sell Limit Zone: 3385 – 3387
⛔️ Stop Loss (SL): 3399
🎯 Take Profit (TP1): 3368
🎯 Take Profit (TP2): 3355
📌 Note:
The detailed trading plan for capturing the larger wave 4 correction (black) will be updated once sufficient evidence confirms the completion of the blue wave 5.
Happy trading, everyone! 🚀
Trade active
📊 Elliott Wave Analysis – XAUUSD August 4, 2025🔍 Momentum Analysis:
• D1 Timeframe: Momentum is still rising → the overall trend remains bullish.
• H4 Timeframe: Momentum is reversing downward. About 1 hour left until the current H4 candle closes → we expect at least 2 more H4 candles before momentum reaches the oversold zone.
• H1 Timeframe: Momentum is still decreasing → supports a short-term pullback.
🌀 Wave Structure Update:
• Wave 3 may have already completed. Price failed to reach the 3385 target → the Sell setup at 3385 is now canceled.
• Two possible scenarios:
1. Price is in Wave 4, which typically moves sideways and takes time to consolidate.
Wave 4 target zones:
Zone 1: 3342
Zone 2: 3333
2. Price is still in a corrective phase (likely Wave 2 or Wave B): In this case, price could break below 3315.
🎯 Combining Momentum and Wave Structure:
• D1 momentum still supports the bullish trend.
• H4 momentum is nearing the oversold zone and could reverse upward → we lean toward Scenario 1, where price is forming Wave 4.
📈 Trading Plan:
• Since the two Wave 4 target zones are close to each other, it's best to wait for price confirmation around these areas.
• For beginners, we recommend widening the stop-loss by 15 points to avoid premature stop-outs.
✅ Trade Setup Suggestion:
• Buy Zone: 3343 – 3340
• Stop Loss: 3328
• Take Profits:
o TP1: 3368
o TP2: 3385
o TP3: 3398
👉 Join the channel to receive more scalping signals!
Channel Telegram: t.me/+XkFQ95yHVOEwNDc1
Channel Telegram: t.me/+XkFQ95yHVOEwNDc1
Related publications
Disclaimer
The information and publications are not meant to be, and do not constitute, financial, investment, trading, or other types of advice or recommendations supplied or endorsed by TradingView. Read more in the Terms of Use.