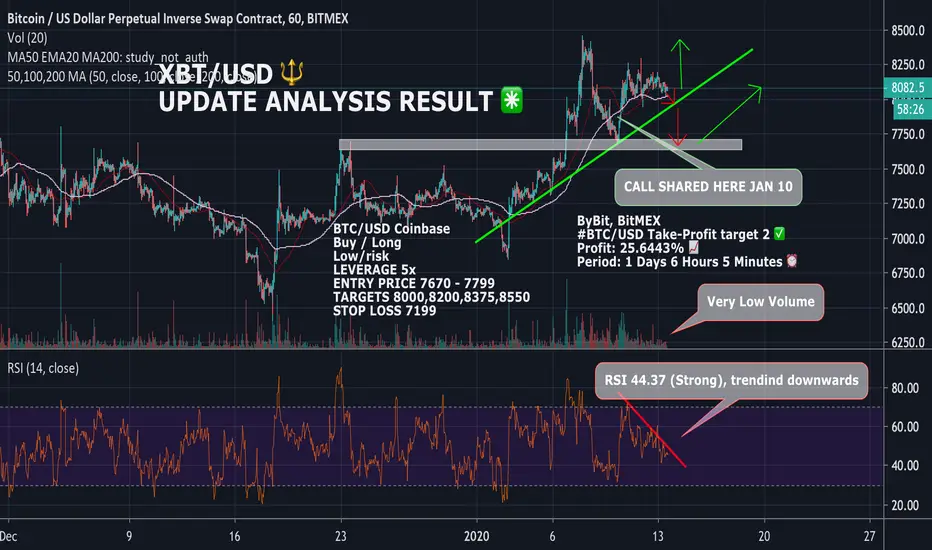
-Today We Have A BTC/USD Chart
- The chart is displaying
- Low volume
-Trading Below 50 EMA 10 , MA 50 , EMA 50
- RSI is currently trending downwards
-We also shared a results trade from Jan 10
-Feel free to comment down below and share you're opinion below
-have a great day
- The chart is displaying
- Low volume
-Trading Below 50 EMA 10 , MA 50 , EMA 50
- RSI is currently trending downwards
-We also shared a results trade from Jan 10
-Feel free to comment down below and share you're opinion below
-have a great day
Disclaimer
The information and publications are not meant to be, and do not constitute, financial, investment, trading, or other types of advice or recommendations supplied or endorsed by TradingView. Read more in the Terms of Use.
Disclaimer
The information and publications are not meant to be, and do not constitute, financial, investment, trading, or other types of advice or recommendations supplied or endorsed by TradingView. Read more in the Terms of Use.