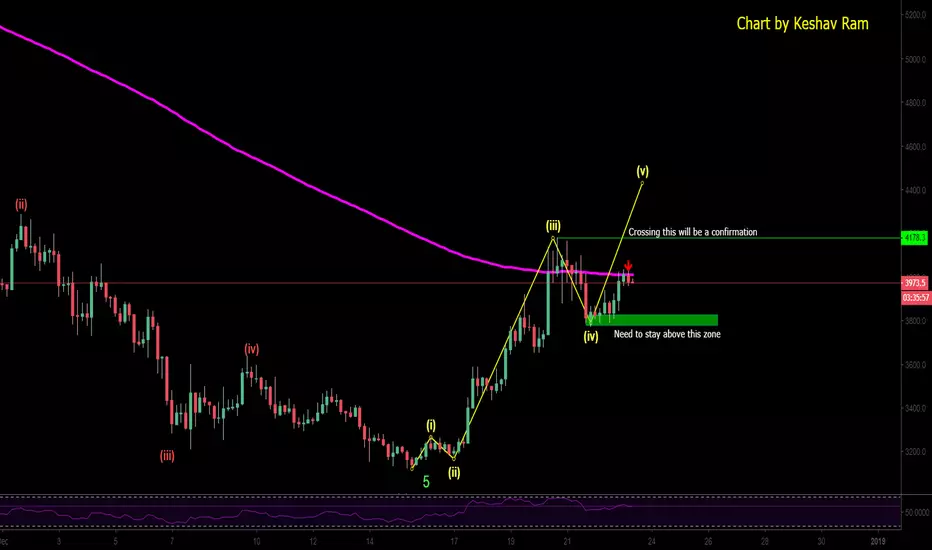
This chart assumes that there is one more wave that has to play out. I've mentioned in my previous chart that 0.382 Fib could be a turn around if we are still bullish, and this chart is inline with that theory. However the 200 EMA (Pink) is offering resistance and we need to overcome that
Here, wave 2 retraced 0.618 Fib (deeper) and wave 4 retraced 0.382 Fib (shallow), another reason to think this is a 4th wave in play and there will be a 5th wave
There is a chance we go lower as well, and so I drew the green zone as reference, the actual confirmation would be when we cross the last top (wave 3)
Here is the previous chart for a little more bearish view

Take Care. Stay Safe
Here, wave 2 retraced 0.618 Fib (deeper) and wave 4 retraced 0.382 Fib (shallow), another reason to think this is a 4th wave in play and there will be a 5th wave
There is a chance we go lower as well, and so I drew the green zone as reference, the actual confirmation would be when we cross the last top (wave 3)
Here is the previous chart for a little more bearish view
Take Care. Stay Safe
Note
We got stopped at the Weekly 200 EMA resistance, this could be the end of the 5th wave, but if resistance is crossed we may go up higher. I'm out of position now and may enter above $4200Note
Looks like we maybe done with the 5 waves (Unless we cross $4250)Note
Yup, that's done. Time to take profitsTrade closed: target reached
Follow me for more updates
twitter.com/imkeshav
youtube.com/channel/UCskbBdZstBUQ_4y2o912zzw
twitter.com/imkeshav
youtube.com/channel/UCskbBdZstBUQ_4y2o912zzw
Related publications
Disclaimer
The information and publications are not meant to be, and do not constitute, financial, investment, trading, or other types of advice or recommendations supplied or endorsed by TradingView. Read more in the Terms of Use.