
We just looked at Stellar Lumens (XLMBTC) on the weekly time-frame, the long-term chart, now we are going to take a closer look and see what is going on...
Let's start by zooming in on the chart above:
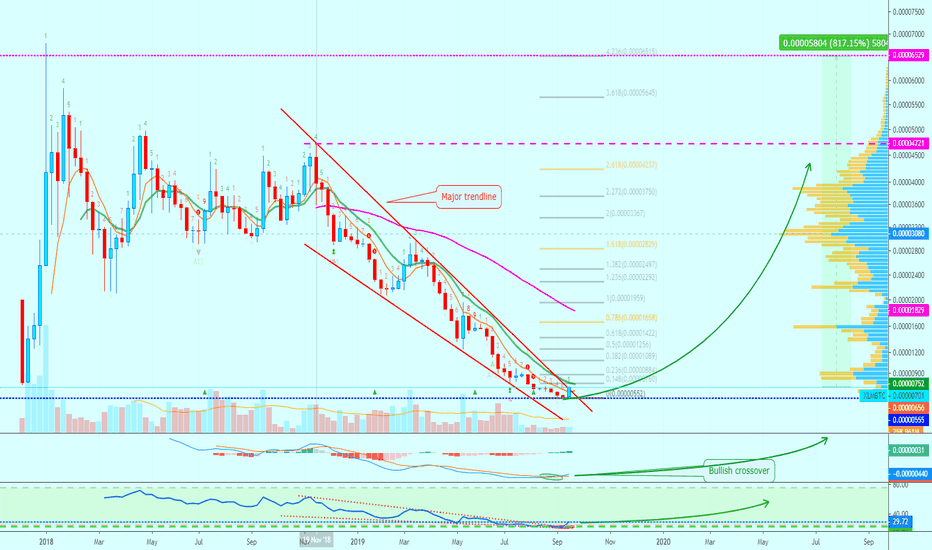
We can see XLMBTC on a very steep decline since November 2018... Stellar never did let go and has been going down since... Only now early reversal signals are starting to show up.
If we compare Stellar to other altcoins, we are likely to see some huge growth in the weeks to come... All the details are shared on the chart above.
All the targets are clearly marked... Stellar Lumens is now super bullish.
Thanks a lot for your continued support.
Namaste.
_____________________________
Weekly analysis for Stellar Lumens (XLMBTC)
Let's start by zooming in on the chart above:
We can see XLMBTC on a very steep decline since November 2018... Stellar never did let go and has been going down since... Only now early reversal signals are starting to show up.
- Here we can see a new low being hit (bottom dashed line).
- Here can see the volume breakout... We can see volume decreasing and then a sudden jump to print higher volume bars as well as break pass resistance.
- The RSI is super strong, over 66.85. This is the highest it has been since March 2019.
If we compare Stellar to other altcoins, we are likely to see some huge growth in the weeks to come... All the details are shared on the chart above.
All the targets are clearly marked... Stellar Lumens is now super bullish.
Thanks a lot for your continued support.
Namaste.
_____________________________
Weekly analysis for Stellar Lumens (XLMBTC)
Note
+25% Growth after sharing on Binance.If you look at Coinbase for the XLMBTC pair, this one exchange reached up to 72%+ of profits from our published price... It will grow more.
Thanks a lot for the support.
Namaste.
Note
Stellar Lumen vs US Dollar (XLMUSD)
🚨 TOP FREE Trades
ETH +1700% · AAVE +1134%
XRP +749% · DOGS +868%
BTC +563% · SOL +658%
t.me/anandatrades/1350
🚨 FREE Analyses & New Results
t.me/masteranandatrades/6499
🚨 PREMIUM LIFETIME (Since 2017)
lamatrades.com
ETH +1700% · AAVE +1134%
XRP +749% · DOGS +868%
BTC +563% · SOL +658%
t.me/anandatrades/1350
🚨 FREE Analyses & New Results
t.me/masteranandatrades/6499
🚨 PREMIUM LIFETIME (Since 2017)
lamatrades.com
Related publications
Disclaimer
The information and publications are not meant to be, and do not constitute, financial, investment, trading, or other types of advice or recommendations supplied or endorsed by TradingView. Read more in the Terms of Use.