I'm observing a potential bottom formation on 
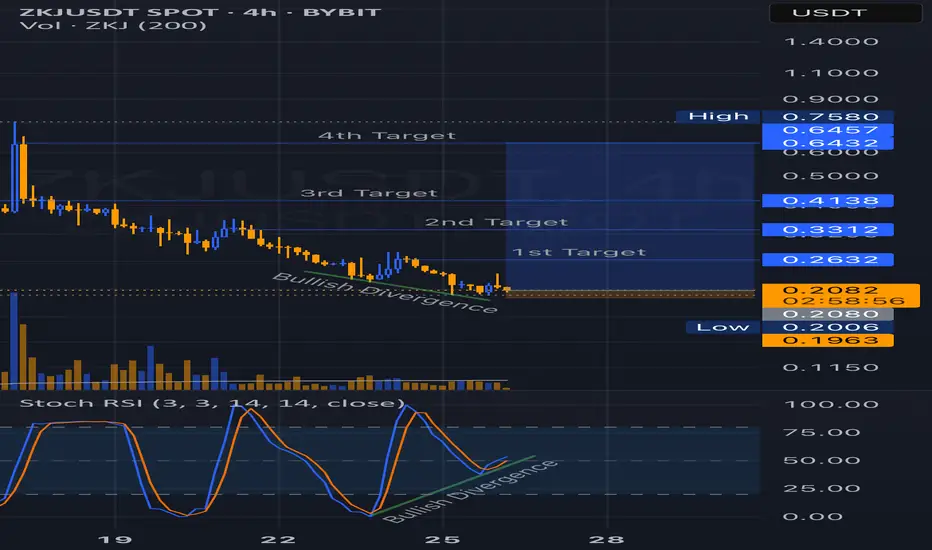
 ZKJUSDT 4H chart, supported by a clear bullish divergence between price action and the Stochastic RSI.
Price has been making lower lows, while the Stoch RSI is showing higher lows — indicating a possible momentum shift. This divergence suggests that selling pressure may be weakening and a potential reversal could be near.
I've marked 4 target levels based on previous structure and Fibonacci zones:
1st Target: 0.2632
2nd Target: 0.3312
3rd Target: 0.4138
4th Target: 0.6432 - 0.6457
Key support zone lies around 0.1963 - 0.2080.
Invalidation if price breaks below this support range.
Not financial advice. Always do your own research!
Disclaimer
The information and publications are not meant to be, and do not constitute, financial, investment, trading, or other types of advice or recommendations supplied or endorsed by TradingView. Read more in the Terms of Use.
Disclaimer
The information and publications are not meant to be, and do not constitute, financial, investment, trading, or other types of advice or recommendations supplied or endorsed by TradingView. Read more in the Terms of Use.