Understanding the Inverted Cup and Handle Chart PatternUnderstanding the Inverted Cup and Handle Chart Pattern
Understanding chart patterns is fundamental for market participants. This article delves into the inverted cup and handle formation, a bearish signal indicating a potential downward movement. Explore its identification, trading strategies, psychological underpinnings, common pitfalls, and more to boost your trading knowledge.
What Is the Inverted Cup and Handle Pattern?
The inverted cup and handle, sometimes called an upside-down cup and handle pattern, is a bearish chart pattern that may appear during up- and downtrends. It is the opposite of the traditional cup and handle pattern, which is bullish. The inverse formation consists of two main parts: the "cup," which is an inverted U-shape, and the "handle," a small upward retracement following the cup.
Identifying the Inverted Cup and Handle Pattern
Identifying the inverse cup and handle pattern involves recognising a specific sequence of market movements that signal a potential bearish move. Here's a step-by-step overview of identifying this formation:
Cup Formation
- Shape: The pattern begins with an inverted U-shaped "cup." The price gradually rises, consolidates, and then begins to decline, reflecting a shift from bullish to bearish sentiment.
- Depth: The cup should have a rounded top, not a sharp V-shape, indicating a gradual reversal. The depth of the cup can vary but typically represents a significant portion of the preceding movement.
Handle Formation
- Upward Retracement: After the cup's formation, prices usually experience a minor upward retracement or consolidation, forming the "handle." This movement should be relatively short and not exceed the initial high of the cup.
- Shape and Duration: The handle often appears as a small flag or pennant and should be brief in duration compared to the cup. An optimal handle retraces no more than half of the cup’s depth.
Breakout Confirmation
- Neckline Break: The pattern is confirmed when prices break below the neckline, the lowest point of the handle. This breakout often leads to a significant decline in prices, signalling a bearish trend.
- Volume Surge: Volume typically decreases during the formation of the cup and increases as prices decline, especially during the handle formation. A substantial increase in volume during the breakout can validate the pattern and minimise the risk of false signals.
The Psychology of the Inverted Cup and Handle
The psychology behind the inverse cup and handle pattern is rooted in market sentiment and behavioural finance. This bearish pattern reflects a shift from optimism to pessimism among traders.
- Initial Uptrend: The formation starts with an upward movement, where traders are generally bullish, driving prices higher. This phase is marked by growing confidence and increasing demand.
- Formation of the Cup: As prices peak, consolidate, and start to decline, some traders begin to take profits, leading to reduced buying pressure. The rounded decline of the cup signifies a gradual shift in sentiment from bullish to bearish as traders become cautious and selling pressure mounts.
- Handle Formation: The minor upward retracement forming the handle indicates a brief period of consolidation where the market tests the resolve of buyers. It can be considered a dead cat bounce. This phase often traps optimistic traders who expect the uptrend to resume, but the overall sentiment remains fragile and cautious.
- Breakout and Decline: The decisive break below the neckline represents a culmination of bearish sentiment. At this point, selling pressure overwhelms any remaining bullishness, leading to a sharp decline. The volume surge during this breakout confirms the shift in market psychology from hopeful to bearish as traders rush to exit their positions or initiate short sales.
Trading the Inverted Cup and Handle Pattern
Trading the inverted cup and handle pattern involves careful identification and strategic decision-making to maximise potential returns. This pattern presents two primary entry points for traders: during the handle formation or after the neckline break.
Entry on the Break of the Handle
- Risk-Reward Advantage: Entering on the breakout of the handle’s lower boundary offers a better risk-to-reward ratio but requires more skill and confidence in pattern recognition.
- Technical Tools: Traders often use a medium-term moving average (like 21 periods) to confirm the downward leg of the handle. A decisive close below the moving average indicates a continuation of the downward handle leg.
- Momentum Indicators: Using momentum indicators like the RSI (Relative Strength Index) or stochastic oscillator helps confirm downward movement. Bearish divergence suggests that the bearish trend is likely to continue.
- Volume Analysis: Increasing volume during the handle's breakout indicates strengthening seller control. High volume often validates the pattern and potentially reduces the risk of false signals. Note that volume data may be less reliable in a decentralised forex market.
- Stop Loss and Profit Target: Traders typically place a stop loss above the handle's high to potentially protect against upward spikes. The reverse cup and handle pattern target is usually set at a distance equal to the cup's height, projected downward from the handle's breakout point, although it can be greater if the retracement is particularly shallow.
Entry After the Neckline Break
- Confirmation Advantage: Waiting for the neckline break offers greater confirmation of the formation but may provide a less favourable risk-to-reward ratio.
- Price Action: A decisive close below the pattern's low, ideally with a strong candlestick and minimal wicks, indicates a reliable breakout. This typically confirms the bearish trend and provides a clear entry signal.
- Volume Confirmation: Higher volume during the neckline break can further validate the pattern and indicate that the breakout is genuine and not a false signal.
- Stop Loss and Profit Target: In this scenario, the stop loss is typically set above the handle's high. The profit target remains the same, projecting the cup's height downward from the breakout point.
Common Mistakes to Avoid
When trading the upside-down cup and handle pattern, avoiding common mistakes is key for maximising potential returns. Some of the more common mistakes traders make include:
- Premature Entry: Entering a trade too early, before the handle completes or the neckline breaks, can lead to false signals and losses. Most traders wait for clear confirmation, such as a decisive close below the neckline with increased volume.
- Ignoring Volume: Volume is a critical component in confirming the pattern. Low volume during the breakout phase may indicate a fakeout. Traders typically look for a substantial increase in volume to validate the pattern.
- Incorrect Pattern Identification: Misidentifying the pattern is a common error. The cup should have a rounded bottom, not a sharp V-shape, and the handle should be relatively short. Accurate identification requires practice and attention to detail.
- Overlooking Market Conditions: External factors, such as news events or broader market trends, can impact the pattern’s reliability. Traders consider these conditions when planning their trades.
Advantages and Disadvantages
As with all chart patterns, the inverted cup and handle pattern comes with its pros and cons. Here are some key advantages and disadvantages of using this pattern:
Advantages
- Clear Signal: The pattern provides a clear signal of a potential bearish movement, helping traders anticipate market declines.
- Risk Management: With defined entry and exit points (handle high for stop loss and cup depth for profit target), it aids in effective risk management.
- Flexibility in Analysis: Several forms of analysis, from support/resistance and momentum indicators to volume and price action, can be used to trade the pattern.
- Versatility: Applicable across various timeframes and markets, including stocks, forex, and commodities, making it a versatile tool for different trading strategies.
Disadvantages
- Complex Identification: Accurately identifying the pattern can be challenging, requiring significant experience and skill.
- Rarity: The pattern doesn’t occur frequently, limiting trading opportunities.
- False Breakouts: Like all chart patterns, it is susceptible to false breakouts, especially if not confirmed with volume and other technical indicators.
- Timing Sensitivity: Entering too early during the handle formation can result in premature positions, while waiting for the neckline break might reduce the risk-to-reward ratio.
The Bottom Line
The inverted cup and handle pattern is one of the most popular chart patterns among traders of all levels. However, like any technical formation, it should be used alongside other indicators and sound risk management to potentially increase its effectiveness. By mastering patterns like the inverted cup and handle, traders can gain deeper insights into market psychology and price action to navigate volatile markets with greater confidence.
FAQ
What Is the Inverse Cup and Handle Pattern in Forex?
The inverse cup and handle pattern in forex is a bearish chart pattern. It features an inverted U-shaped cup followed by a small upward retracement (the handle). This pattern suggests that sellers are gaining control, and prices are likely to decline further once the neckline is broken.
How Can You Trade the Inverse Cup and Handle?
Traders can enter positions either on the break of the handle’s lower boundary or after the neckline break. Entering during the handle might offer a better risk-to-reward ratio, while waiting for the neckline break provides greater confirmation. Key tools to validate the breakout include moving averages, momentum indicators like RSI or stochastic oscillator, and volume analysis.
What Happens After the Reverse Cup and Handle Pattern?
After the reverse cup and handle pattern is completed, the price typically moves downward strongly. This bearish movement is often confirmed by a strong breakout below the neckline with increased volume, signalling a sustained decline in prices.
What Is the Opposite of the Cup and Handle?
The opposite of a cup and handle is the inverse cup and handle pattern. While the cup and handle indicates a bullish movement, the inverse version signals a bearish trend.
Is the Inverted Cup and Handle Bullish or Bearish?
The inverted cup and handle pattern is bearish. It indicates that the price will move downwards, suggesting that traders may open short trades.
This article represents the opinion of the Companies operating under the FXOpen brand only. It is not to be construed as an offer, solicitation, or recommendation with respect to products and services provided by the Companies operating under the FXOpen brand, nor is it to be considered financial advice.
Cupandhandlepattern

Learn How to Trade Cup and Handle Pattern on Forex & Gold
If you are studying a price action, you should definitely know how to identify and trade Cup and Handle pattern formation.
Being applied properly, it can generate big profits.
In this educational article, I will teach you how to identify this pattern. We will discuss its psychology and I will share with you 2 trading strategies.
📏And let's start with the structure of the pattern.
The pattern has 3 important elements:
Cup - long-term correctional movement that tends to move steadily from a bearish trend to a bullish trend.
Handle - short-term correctional movement with signs of bullish strength.
Neckline - upper horizontal boundary of the pattern - a strong resistance that the price constantly respects.
⚠️Being formed, it warns you about a highly probable coming bullish movement.
The trigger that confirms the initiation of a bullish wave is a breakout of the neckline of the pattern and a candle close above.
Here is the example of a completed C&H with a confirmed neckline breakout, indicating a highly probably coming bullish movement.
Depending on the preceding price action, Cup & Handle Pattern can either be a trend-following or reversal pattern.
📉If the pattern is formed after a bearish impulse. It is considered to be a reversal pattern.
Here is the example of a reversal C&H that I spotted on EURUSD.
📈If the pattern is formed at the top of a bullish impulse , it is considered to be a trend following pattern.
Here is the example of a trend following C&H that I spotted on GBPJPY.
The thing is that while the price forms the C&H, buying volumes are accumulating. Even though, buyers are hesitant and reluctant initially, their confidence grows, and the accumulation leads to explosive neckline breakout.
There are 2 strategies to trade this pattern.
✔️ Strategy 1.
That approach is quite risky , but the reward can be quite substantial.
You should monitor the price action when the price is creating a handle. Occasionally, the price starts trading in a falling channel: parallel or contracting one.
Your trigger will be a bullish breakout of its resistance and a candle close above.
Once the violation is confirmed, you can buy aggressively or set a buy limit order on a retest.
Stop loss will lie below the lows of the channel.
Target will be the closest key resistance.
Here is the example of the handle being a falling channel.
✔️ Strategy 2.
Wait for a breakout of a neckline of the pattern.
Once a candle closes above that, it will confirm the violation.
Buy the market aggressively or set a buy limit on a retest of a broken neckline then.
Stop loss will lie below the lows of the handle.
Target will be the closest key resistance.
Here is the example of the trade based on a confirmed breakout of a neckline of C&P on NASDAQ Index.
Applied properly, the strategies may reach up to 70% win rate.
As always, the best pattern will be the one that forms on a key level.
Try it, test it, and good luck in your trading journey.
❤️Please, support my work with like, thank you!❤️

Cup & Handle Pattern TutorialA cup and handle pattern is a bullish continuation pattern that signals a potential upward price movement after a consolidation period. Here's a breakdown of its key components:
Cup: The pattern starts with a downward move in price, forming a rounded bottom (the "cup"). The price then rallies back up to the level where it began, creating a U-shape.
Handle: After the cup forms, the price pulls back downward in a smaller, rounded formation (the "handle"). This handle is typically a consolidation period before the price resumes its upward trend.
Win Rate
The cup and handle pattern is known for its high reliability and success rate. Research shows that it has a 95% success rate in bull markets and an average profit of around 54%. However, it's important to follow strict trading rules to achieve these results

CUP n HANDLE An illustration of Cup and Handle pattern
First look for an initial uptrend of the stock
Later a small pull back
And later reversal of the pull back ....
Breakout of the highest point of the pull back
At retest , look for reversal candles like doji.... Look for tight price action
Enter the trade just above the high of the candle with stop loss below the lowest low of the candles

How To Identify and Trade a Cup & HandleThe Cup & Handle Pattern:
A Comprehensive Guide to Continuation Mastery
In the vast realm of technical analysis, the Cup & Handle pattern emerges as a brilliant beacon of insight—an extraordinary exemplar of a continuation pattern that elegantly unveils the ongoing momentum within an established trend. Its inherent elegance lies in its unparalleled ability to furnish traders with a tangible roadmap, skillfully guiding them through the intricate symphony of price action. As we embark on this enlightening journey of exploration, we shall unveil the multifaceted layers of the Cup & Handle pattern. Our expedition involves an in-depth dissection of its core components, a profound interpretation of its implications, and an unveiling of the critical elements that lend credence to its presence.
1. Cup Formation: The Artful Pause That Speaks Volumes
Nestled at the heart of the Cup & Handle pattern is the captivating creation of the cup formation—a graceful curve that mirrors the contours of a masterfully sculpted cup. This stage encapsulates a momentary respite, a purposeful consolidation within the overarching trend. It embodies a pause that echoes the collective sentiment of market participants, offering a tangible representation of forces seeking equilibrium. The gentle curvature of the cup resonates with the rhythm of the market, seamlessly weaving together the intricate interplay between demand and supply.
2. Handle Formation: The Prelude to Anticipation
Following the organic embrace of the cup, the handle formation emerges—an intriguing prelude that tantalizingly hints at the future. This segment assumes the shape of a concise consolidation, often resembling a brief pullback or a tranquil sideways drift. The handle, akin to a contemplative interlude in a symphonic composition, captures a moment of introspection. It's akin to a traveler pausing at a vantage point, surveying the terrain before embarking on the next phase of their journey. During this introspective intermission, market participants recalibrate their strategies, absorbing insights for the forthcoming movement.
Interpreting the Pattern: Guiding Continuation with Finesse
The Cup & Handle pattern serves as a reliable navigational instrument within the ongoing narrative of a trend:
• Bullish Narratives: In an upward trajectory, the Cup & Handle encapsulates the very essence of continuity. It signifies the unwavering persistence of the prevailing uptrend, elegantly supported by the inherent flow of the pattern's organic formation.
Validation Through Breakout and Volume:
• Breakout Confirmation: The core of the Cup & Handle pattern's credibility hinges upon the breakout above the handle's upper boundary, often referred to as the resistance level. This pivotal juncture serves as a luminous beacon, illuminating potential entry points and validating the pattern's existence.
• Volume as a Harmonic Undertone: Volume analysis lends a harmonious undertone to the pattern's melody. Attentive observation of volume trends during the cup and handle stages adds a resonant chord. Heightened volume during the cup formation, followed by a gentle cadence during the handle, amplifies the pattern's authenticity.
•
Projection and Beyond: Navigating the Path Ahead
• Projected Price Targets: Peer into the future by projecting potential price targets above the neck line breakout. The symphony of Fibonacci levels—62%, 79%, 100%, 127%, and 162.7%—composes a harmonious ensemble of potential completion points.
• Harmonizing Analysis: Synthesize your findings with the broader market landscape. Overlay auxiliary technical tools, such as support and resistance levels, to orchestrate a harmonious fusion of analysis and fine-tune your trading decisions,
•
As we voyage further into the intricate domain of technical analysis, the Cup & Handle pattern takes on a persona beyond mere lines on a chart. It becomes a living embodiment of the intricate dialogue between market psychology and the ebb and flow of price dynamics. In your arsenal as a trader, it functions as a steadfast compass, guiding you with its radiant light through the intricate labyrinth of trends. This is your roadmap to navigating the captivating odyssey of continuation.
"Cup & Handle Unveiled: Mastering Continuation Strategies with TCPLTP"

The Cup and Handle Pattern in TradingGreetings, fellow traders and investors of @TradingView 📈🚀
Keep your eye for cup and handle pattern, a chart formation that hints at potential market possibilities.
The Cup and Handle:
Visualize a cup, complete with a 'U' shape and accompanied by a handle. This chart pattern mimics that very shape, capturing price shifts that can hint at noteworthy market movements. Here's the essence: a cup forms through a gradual downward trajectory, leading to a stabilizing phase, and eventually, a rally that mirrors the extent of the initial decline. This sequence of price action is pivotal in identifying the characteristic cup and handle formation.
Initiated by low trading volume, the formation gathers momentum with rising volume as the left lip of the cup takes form. Subsequently, volume recedes near the cup's bottom, only to surge again towards the right lip and breakout.
The initiation involves a dip in price, followed by stabilization, and finally, a rally that aims to retrace the plummet's impact.
As the cup materializes, it curves into a 'U' shape, while the price dips slightly to craft the handle. Notably, the handle must be smaller than the cup and should exhibit a minor downward trend within the trading range. It's imperative that the handle doesn't dip below one-third of the cup's depth.
Strategy and Execution
Now, how can you effectively trade this compelling pattern? The strategy involves positioning a limit buy order just above the upper resistance of the cup and handle. Simultaneously, set a stop-loss order slightly below the handle's support. This calculated approach ensures that your buy order triggers only when the price breaks through the upper resistance level. This cautious measure shields you from premature entry due to false breakouts.
For traders seeking an extra layer of assurance, patiently waiting for the price to conclusively close above the upper trendline of the handle can provide a higher degree of certainty before initiating the trade.
🌟 Wishing you successful trades and profitable outcomes as you leverage insights from @Vestinda. Remember, patience and careful analysis are your allies on trading path.
Happy trading! 💰

📈 4 BULLISH PATTERNS YOU NEED TO KNOW📌How to easily identify these patterns?
🟢Cup and Handle Pattern
The cup and handle pattern is a bullish continuation pattern that typically occurs after a significant uptrend. It is characterized by a U-shaped "cup" followed by a smaller consolidation known as the "handle." The cup portion represents a temporary pause or correction in the price, forming a rounded bottom. This signifies that selling pressure has diminished, and buyers are stepping in. After the cup formation, the handle is formed as a slight downward drift in price, usually in the form of a small consolidation or a shallow retracement. The handle represents a final consolidation before the resumption of the bullish move. The handle should be relatively smaller in size and have a downward-sloping price action.
🟢Double Bottom
The double bottom pattern is a bullish reversal pattern that signifies a potential trend reversal from bearish to bullish. It consists of two consecutive lows that are approximately at the same level, forming a support level. The first low represents a selling climax or a period of intense selling pressure. After the first low, the price rebounds and retraces to form a temporary high, creating a potential resistance level. However, buyers step in again, pushing the price back up, resulting in a second low that matches or is very close to the level of the first low. This double bottom formation indicates a significant level of support where buying interest outweighs selling pressure.
🟢 Bullish Flag
The bullish flag pattern is a continuation pattern that occurs after a strong upward move in price. It is characterized by a brief period of consolidation, where the price forms a narrow and rectangular range, resembling a flagpole and a flag. The flag portion of the pattern is typically slanted in the opposite direction of the initial price move. The flagpole represents the initial strong upward move, indicating a surge in buying interest. Following the flagpole, the price enters a consolidation phase, represented by the flag. This consolidation allows the price to stabilize and absorb selling pressure. The flag pattern should have parallel trendlines that contain the price action.
🟢Inverse Head and Shoulders
The inverse head and shoulders pattern is a bullish reversal pattern that indicates a potential shift from a bearish to a bullish trend. It consists of three consecutive lows, with the middle low (the head) being lower than the two outer lows (the shoulders). The pattern resembles a head between two shoulders. The left shoulder forms as the price declines, followed by a subsequent rally to create a temporary high. The price then retraces, forming the head, which is lower than both the left and right shoulders. After the head, the price rallies again to form the right shoulder, which is usually slightly higher than the left shoulder.
👤 @QuantVue
📅 Daily Ideas about market update, psychology & indicators
❤️ If you appreciate our work, please like, comment and follow ❤️

Learn How to Trade Cup and Handle (rare but profitable pattern)☕
If you are studying a price action, you should definitely know Cup and Handle formation.
Being applied properly, it can generate big profits.
In this educational article, I will teach you how to identify this pattern. We will discuss its psychology and I will share with you 2 trading strategies.
📏And let's start with the structure of the pattern.
The pattern has 3 important elements:
Cup - long-term correctional movement that tends to move steadily from a bearish trend to a bullish trend.
Handle - short-term correctional movement with signs of bullish strength.
Neckline - upper horizontal boundary of the pattern - a strong resistance that the price constantly respects.
⚠️Being formed, it warns you about a highly probable coming bullish movement.
The trigger that confirms the initiation of a bullish wave is a breakout of the neckline of the pattern and a candle close above.
Here is the example of a completed C&H with a confirmed neckline breakout, indicating a highly probably coming bullish movement.
Depending on the preceding price action, Cup & Handle Pattern can either be a trend-following or reversal pattern.
📉If the pattern is formed after a bearish impulse. It is considered to be a reversal pattern.
Here is the example of a reversal C&H that I spotted on EURUSD.
📈If the pattern is formed at the top of a bullish impulse, it is considered to be a trend following pattern.
Here is the example of a trend following C&H that I spotted on GBPJPY Index.
The thing is that while the price forms the C&H, buying volumes are accumulating. Even though, buyers are hesitant and reluctant initially, their confidence grows, and the accumulation leads to explosive neckline breakout.
There are 2 strategies to trade this pattern.
✔️Strategy 1.
That approach is quite risky, but the reward can be quite substantial.
You should monitor the price action when the price is forming a handle. Occasionally, the price starts trading in a falling channel: parallel or contracting one.
Your trigger will be a bullish breakout of its resistance and a candle close above.
Once the violation is confirmed, you can buy aggressively or set a buy limit order on a retest.
Stop loss will lie below the lows of the channel.
Target will be the closest key resistance.
Here is the example of the handle being a falling channel.
📍Strategy 2.
Wait for a breakout of a neckline of the pattern.
Once a candle closes above that, it will confirm the violation.
Buy the market aggressively or set a buy limit on a retest of a broken neckline then.
Stop loss will lie below the lows of the handle.
Target will be the closest key resistance.
Here is the example of the trade based on a confirmed breakout of a neckline of C&P on NASDAQ Index.
Applied properly, the strategies may reach up to 70% win rate.
As always, the best pattern will be the one that forms on a key level.
Try it, test it, and good luck in your trading journey.
❤️Please, support my work with like, thank you!❤️

Classic Reversal Patterns of Technical Analysis !!!👨🏫I tried to show you the most important Classic Reversal Patterns of Technical Analysis with their 🎯 Targets 🎯.
Please do not forget the ✅' like '✅ button 🙏😊 & Share it with your friends, Thanks, and Trade safe.

bullish and bearish cup and handle pattern hello dear traders,
Here are some educational chart patterns that you must know in 2022 and 2025.
I hope you find this information educational and informative.
We are new here so we ask you to support our views with your likes and comments,
Feel free to ask any questions in the comments, and we'll try to answer them all, folks.
What are the Cup and Handle chart patterns?
A cup and handle pattern is a pattern of price movement on a trading chart that resembles a cup with a handle, from which it derives its name. The cup section of the pattern is formed from a U-shaped price movement, while the handle is a short price channel from the edge of the cup. The handle is actually a pullback after the right Swing of the cup.
As is the case with other chart patterns, the cup and handle pattern shows you how the price has moved in the immediate past, which can help you predict future price movements. The time it takes for pattern formation varies: pattern formation can be as short as seven weeks or as long as 65 weeks or more.
There are two types of patterns: the more popular bullish cup and handle pattern that you can see in bull markets and the inverted cup and handle pattern, also known as the bearish cup and handle pattern, that you can see in bear markets.
In the bullish variant, which occurs in an uptrend, the pattern is formed by a downswing (pullback) that gradually turns into an upswing (in the trend direction) followed by a small pullback (a slight downward drift that creates a handle )
The reversal/bearish type, which appears in a downtrend, is formed by an upswing (pullback) that gradually turns into a downswing to continue the downtrend, but then pulls back (handle) a bit.
Understanding the structure and inversion of the cup and handle pattern
The cup and handle pattern can form in any time frame, but as a swing trader, you should focus on the daily time frame. To identify the cup and handle pattern or reversal type, you need to understand the price movements that form its structure. For example, to be a continuation pattern, there must be a prior trend before a cup and handle pattern can form. Let us look at both patterns one by one.
The bullish Cup and Handle pattern:-
An uptrend: For a bullish cup and handle pattern to form, there must be an established uptrend, but the trend must not be too mature because the more mature the trend, the less likely it is to continue. A trend on the daily time frame that is a few months old is fine.
Cup: The cup is formed from a normal bust that gradually curves upward, creating a "U" shape. It should have a bowl or round bottom and not a sharp "V" shaped bottom. The round bottom ensures that there is a consolidation pattern with valid support at the bottom of the "U" cup. In addition, the pattern on both sides of the cup should be of equal height, but this may not always be the case.
Cup depth: The cup should not be too deep. Generally, the cup depth should be around the 38.2% Fibonacci retracement of the previous advance. However, with overreaction in more volatile markets, retracements can range from 38.3% to 50% Fibonacci. In extreme cases, the retracement can reach 61.8% Fibonacci, which is in line with Dow Theory.
Handle: This is a pullback that forms after the higher forms on the right side of the cup. This is a minor pullback or consolidation that sometimes resembles a downward-sloping flag or pennant. This is just a small, final consolidation/pullback before a bigger breakout, but could lead to a retracement to the 38.2% Fibonacci retracement of the swing high of the cup. The smaller the retracement, the more bullish the formation and the more significant the breakout.
Duration: While the cup can last from 1 to 6 months (or several years on a weekly chart), the handle can take about 1-4 weeks to form.
The bearish/inverse Cup and Handle pattern:-
A downtrend (bear market): There must be an established downtrend for the inverted Cup and Handle pattern to be meaningful. However, the trend should be relatively young as downtrends don’t last that much. On the daily timeframe, the trend should be from a few weeks to a few months.
The dome (inverted cup): The dome of this pattern is formed by a normal price rally in a downtrend (pullback), which gradually turns to a downward swing, thereby forming a dome shape. It should have a rounding top and not a sharp pyramid top. A rounding top ensures that the inverted cup is a consolidation pattern with valid resistance at the top of the structure. Both sides of the dome may or may not have equal lows.
Dome height: The dome should not be too high. Usually, the height should be about 38.2% Fibonacci retracement of the preceding downswing, but the retracement could range from 38.3% to 50% Fibonacci in more volatile markets with over-reactions. In extreme situations, it could be up to 61.8% Fibonacci.
The handle: This is a slight pullback that follows the downswing that forms the right side of the dome. It is a small consolidation that often looks like a bearish flag or pennant that slopes upward. The handle can retrace up to 38.2% Fibonacci of the dome’s swing down, but the smaller the retracement, the more bearish the formation and the more significant the breakout.
Duration: The dome may take about 4 to 6 weeks or more to form, while the handle may take about a week or two.
How to trade the Cup and Handle chart pattern:-
The Cup and Handle pattern and the inverse type are potent trend continuation signals. When you see any of them, you have to trade in the direction of the trend. While you can trade these price action chart patterns on their own, it may be wise to confirm the trend with some tools, like trend lines and moving averages.
Trading the bullish Cup and Handle pattern:-
The bullish Cup and Handle pattern forms an uptrend and gives a bullish breakout signal. You might have to fix an uptrend line or a moving average to confirm the trend. Here is how you trade the pattern:
Entry:-
With this pattern, a buy signal occurs when the price breaks out of the upper trend line of the price channel that forms the handle. There should be a substantial increase in volume on the breakout above the handle’s resistance. Go long at the close of the breakout candlestick. Alternatively, you place a stop-buy order slightly above that upper trend line. Sometimes, it is prudent to wait for a breakout above the resistance line established by the highs of the cup.
Stop loss:-
You need a stop-loss order to get you out of the trade if after buying the breakout, the price drops, instead of rising. Your stop loss should be at a level that invalidates the pattern’s signal, and that level is below the lowest point of the handle.
Profit target:-
There are two potential profit target levels for this pattern. The first profit target is estimated by measuring a distance equivalent to the size of the handle, starting from the breakout point. The second profit target is estimated by measuring a distance equal to the depth of the cup, again, starting from the point of the breakout.
Trading the bearish Cup and Handle pattern:-
The bearish Cup and Handle pattern forms a downtrend and is traded as a bearish breakdown signal. So, you can use it to go short on the market if you want. This is how you trade the pattern:
Entry:-
You have a sell signal when the price breaks below the lower trend line of the price channel that forms the handle. There should be a spike in volume when this breakdown happens. You may go short at the close of the breakdown candlestick, or you place a stop-sell order slightly below that lower trend line. It might be wise to wait for a break below the support line established by the lows of the inverted cup.
Stop loss:-
When you are trading the inverse Cup and Handle pattern, you should place your stop loss order above the highest point of the handle.
Profit target:-
Two potential levels are good for your profit target: the first profit level is estimated by measuring a distance equal to the size of the handle, starting from the breakdown point, while the second profit level is estimated by measuring a distance equal to the height of the dome (inverted cup), starting from the point of the breakdown.
Trade with care
If you like our content, please feel free to support our page with a like, comment
Hit the like button if you like it and share your charts in the comments section.
Thank you

CUP AND HANDLE PATTERNAll the anaysis points are mentioned on chart. Pattern will be completed only after close of monthly candle.
Disclaimer: I am not SEBI registered.

📊 Understanding the Cup and Handle PatternA cup and handle is a technical analysis pattern that appears on a chart as a U-shaped pattern, followed by a small downward drift, resembling a handle.
It is important to note that like all technical analysis patterns, the cup and handle pattern is not a guarantee of future price movements and should be used in conjunction with other analysis techniques.
📈Cup and Handle
It is considered a bullish pattern and is often used by traders to indicate the potential for an upcoming price increase.
The pattern is formed when the price of a security falls, reaches a bottom, and then rises back up to near its previous high before falling again. The downward drift that follows is the handle.
The pattern is considered complete when the price breaks through the resistance level (the top of the cup) and continues to rise. Technical traders using this indicator should place
a stop buy order slightly above the upper trendline of the handle part of the pattern.
📉Inverted Cup and Handle
After the cup forms and the beginning of a noticeable handle takes shape, begin to monitor trading volume closely.
One way to think of the inverted handle is a follow-up to an inverted cup. The inverted handle retraces the initial move, but not to the level of the original trend.
Once you see a retracement in the form of an inverted handle of the original inverted cup pattern, setting a stop loss while selling the trend could be a potential trade idea.
👤 @algobuddy
📅 Daily Ideas about market update, psychology & indicators
❤️ If you appreciate our work , Please like, comment and follow ❤️

🟨 Cup and Handle Pattern - cheat sheetWhat is the Cup and Handle Pattern?
One of the most important chart patterns in the stock market is the Cup and Handle Pattern, invented by William O’Neill. Sometimes you might see it abbreviated as CWH. It also holds the crowd proclaimed title as one of the most profitable and reliable breakout patterns. The Cup and Handle Pattern forms as a bullish continuation pattern that can be found during strong trend.
––––––––––––––––––––––––––––––––––––
Is Cup and Handle Pattern Bullish?
William O'Neil cup and handle patterns represent bullish continuation patterns that mark consolidation periods which are followed by breakouts. This pattern includes two components: cup and handle . After advancing, this cup is formed in a bowl shape or with a rounded bottom. Handle forms in the upper third of the cup.
––––––––––––––––––––––––––––––––––––
Stages of a Cup and Handle Pattern Formation
Stage 1 Setup:
The pattern starts when a price raises from a former base, making the prior trend a bullish trend. At some the profit taking starts taking place and the stock begins the decline, forming the high of the cup. The high of the cup is also called the ‘Left Cup’
Stage 2: Decline:
The stock starts to form a new base. It is normal to see above average volume at the beginning of the decline. The volume element is important since it ensures that later buyers to the party are out of the stock and do not provide an overhead supply. By the end of Stage 2 the volume would have fallen below average. This low trading volume is combined with price consolidation around the low of the cup.
Stage 3 Recovery:
The stock starts to recover and the volume on up days starts to pick up. This indicates that institutions are taking interest in the stock. Pro tip: look for low volume on down days. Now we still have a few more types of players into the stock: the bottom fishers who bought in at the low of the cup and the bag holders who have bought at the high of the cup and have been sitting on a loss. As the stock price moves up, these would partially close their positions making the recovery process a stair stepping process rather than a V shaped recovery. As the price reaches close to the High of the cup, the last bag-holders will cut their losses and will create a large volume sell-off. At this point the “Pivot” is formed or the “High of the Handle”.
Stage 4 Consolidation:
After the High of the handle, the price is likely to continue its handle formation. The handle pattern occurs as there are still weak hands in the ticker. A shakeout preferably on higher volume is considered a bullish continuation in the cup and handle pattern formation . This indicates that all overhead supply is depleted. The point when the price starts to climb again and reaches the high of the handle is the breakout point. We will look for a to price breaks on higher volume to indicate that institutions have taken control of the stock and that the sky is clear to move upwards. A rule of thumb is to look for a price target with the same value as the prior advance from previous base as the one subsequent to Stage 1.
––––––––––––––––––––––––––––––––––––
Hope this helps!
Example of Cup and Handle on AAPL from 2003

Rare PUMP pattern. Look for a "Base" on BTC🚀Every trader want to catch the pumps because only in this situation you can get the highest RR. In this educational idea we will talk about pattern which help you to identify upcoming pumps. It`s a base pattern.
"Base" is consolidation pattern which is forming at the market bottom and a part of famous cup and handle pattern. "Base" is acually a copy of cup and it`s lead to PUMP✅when the price break up this pattern.
📊 Why base is important for the long traders❓ Because there is a lot of whales have enough liquidity to accumulate their position. The big volume bars at the bottom are also confirmed that whales buy ADA at the "dip"!
📊 Why the formation of the base leads to PUMP❓ As i said the base is the consolidation pattern where the big players can accumulate enough✅liquidity from scared retail traders.
🔥In the most cases the base forming at the market bottom when the biggest part of traders think that crypto continue to DUMP and sell their crypto at loss or at breakeven. But who buys this huge amount of crypto? Of course this is someone who don`t scare - the big players.
🔥Additionally, the price "compresses like a spring" in consolidation range and when the crypto break up the base the "spring uncompresses" and PUMP begin.
📊 What indicator helps to identify the base and upcoming PUMPS❓ This is a basic volume indicator. The volume growth helps you to identify the bottom. A lot of crypto sells by retail traders and the volume bars grows.
📊 What timeframes should you use to have beggiest winrate (80-90%)❓ The higher the timeframe the better, especially for beginners:
1️⃣ 4h
2️⃣ 1d
3️⃣ 1w
🚩 You need to have experience and complete scalping studying to identify PUMPS at lower timeframes (5m, 15m, 1h).
Look for the "base" on the higher timeframes then move to lower timeframes to have clear understanding of this pattern and find the best entry point. I use the trandline breakout to open a long before the pump. Maybe, you will share your tools to open a long before a pump?
🚩 Traders, do we have the base on BTC now❓ Are retail traders scared and think that BTC will fall lower? Let`s discuss it in the comment!
💻Friends, press the "like"👍 button, write comments and share with your friends - it will be the best THANK YOU.
P.S. Personally, I open an entry if the price shows it according to my strategy.
Always do your analysis before making a trade.

The Cup and Handle Pattern - AnatomyOne of the most important price patterns is the Cup with Handle pattern, invented by William O’Neill. If you want to read more about it check out my link to substack in Bio when I will post Episode 3 of Chart anatomies on the 9th August.

TRADING THE CUP & HANDLE PATTERN by Constantino
The Cup and Handle pattern was developed and popularized by William J. 0’Neil in the 1980s
through his CANSLIM methodology, Investors Business Daily newspaper and his book 'How to Make Money
in Stocks.'
Cup and Handle pattern resembles a Cup with a Handle. Cup and Handle patterns are continuation
patterns, and they usually form in bullish trends. Most Cup and Handle patterns are very reliable
and offer great trading opportunities. They also form in all markets and in all time-frames. The
“Cup” formation is developed as consolidation phase during price rallies from the round bottom
formation over multiple weeks to months. The “Handle” part forms due to a price correction
after“Cup"formation and before a clear breakout to the upside.
Cup and Handle pattern structure show the momentum pause after reaching a new high in a U-Shape
form, followed by another attempt to breakout. When this breakout from the rim of the cup fails it
starts to fall back to build the 'Handle' structure. Usually, the handle structures are small, and
the handle depth should not exceed more than 50% of cup depth. This handle part of the pattern
generates interest in buyers as they expect the pattern to breakout from these levels. The pattern
is valid only if price convincingly breaks out with increased volume above the rim of the cup
levels.
Key pattern characteristics
Trend: Prior trend before the formation of Cup & Handle pattern must be bullish
Cup Shape: The Cup formation should be 'U' shaped and not 'V' shaped.
Cup Depth: Cup should retrace at least 25% of cup depth but may not be more than 50% of cup depth.
Handle: Handle resembles a flag formation in a pullback fashion. Breadth (Width) of Handle is
usually small, and it can be 25-40% of Cup's width.
Volume: Volume diminishes during the first half of the cup and increases during the right side rise
of the cup. Handle also exhibits a similar volume behaviour. Volume should see a significant surge
during breakout above the rim level.
Duration: Cup and Handle patterns must have extended breadth (2 to 12 weeks) to be a valid pattern.
How to Trade
Entry: Cup and Handle patterns present great bullish trading opportunities. When the pattern breaks
out above the rim of the cup, a 'long' trade is entered above the high of the breakout bar.
Stop: A stop should be placed below the middle of the handle level.
Targets: Targets are placed at 62-100% of the Height of the cup

CHFJPY BULLISH CUP AND HANDLE PATTERN
The Cup and Handle pattern was developed and popularized by William J. 0’Neil in the 1980s
through his CANSLIM methodology, Investors Business Daily newspaper and his book 'How to Make Money
in Stocks.'
Cup and Handle pattern resembles a Cup with a Handle. Cup and Handle patterns are continuation
patterns, and they usually form in bullish trends. Most Cup and Handle patterns are very reliable
and offer great trading opportunities. They also form in all markets and in all time-frames. The
“Cup” formation is developed as consolidation phase during price rallies from the round bottom
formation over multiple weeks to months. The “Handle” part forms due to a price correction
after“Cup"formation and before a clear breakout to the upside.
Cup and Handle pattern structure show the momentum pause after reaching a new high in a U-Shape
form, followed by another attempt to breakout. When this breakout from the rim of the cup fails it
starts to fall back to build the 'Handle' structure. Usually, the handle structures are small, and
the handle depth should not exceed more than 50% of cup depth. This handle part of the pattern
generates interest in buyers as they expect the pattern to breakout from these levels. The pattern
is valid only if price convincingly breaks out with increased volume above the rim of the cup
levels.
Key pattern characteristics
Trend: Prior trend before the formation of Cup & Handle pattern must be bullish
Cup Shape: The Cup formation should be 'U' shaped and not 'V' shaped.
Cup Depth: Cup should retrace at least 25% of cup depth but may not be more than 50% of cup depth.
Handle: Handle resembles a flag formation in a pullback fashion. Breadth (\\/idth) of Handle is
usually small, and it can be 25-40% of Cup's width.
Volume: Volume diminishes during the first half of the cup and increases during the right side rise
of the cup. Handle also exhibits a similar volume behaviour. Volume should see a significant surge
during breakout above the rim level.
Duration: Cup and Handle patterns must have extended breadth (2 to 12 weeks) to be a valid pattern.
How to Trade
Entry: Cup and Handle patterns present great bullish trading opportunities. When the pattern breaks
out above the rim of the cup, a 'long' trade is entered above the high of the breakout bar.
Stop: A stop should be placed below the middle of the handle level.
Targets: Targets are placed at 62-100% of the Height of the cup

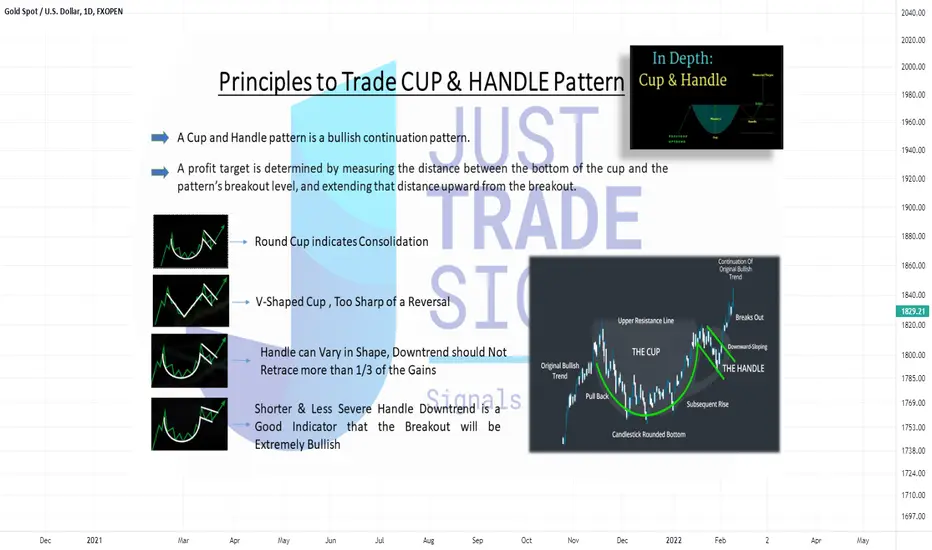
Principles to Trade Cup & Handle PatternHi Friends,
We are glad to share this material on "CUP & HANDLE PATTERN".
William O'Neil's Cup with Handle is a bullish continuation pattern that marks a consolidation period followed by a breakout. There are two parts to the pattern: the cup and the handle. The cup forms after an advance and looks like a bowl or rounding bottom. As the cup is completed, a trading range develops on the right-hand side and the handle is formed. A subsequent breakout from the handle's trading range signals a continuation of the prior advance.
The theory behind the cup and handle pattern is that if the price tried to drop but then rebounded, there must be strong buying momentum behind the asset to continue moving higher. This could attract traders to open a position at the price rise, or at least avoid opening a short position against it.
How this Pattern works?
1. The cup should resemble a bowl or rounding bottom. The perfect pattern would have equal highs on both sides of the cup, but this is not always the case.
2. After the high forms on the right side of the cup, there is a pullback that forms the handle. The handle is the consolidation before breakout and can retrace up to 1/3 of the cup's advance, but usually not more.
3. The cup can be spread out from 1 to 6 months, occasionally longer. Ideally, the handle will form and complete over 1-4 weeks.
4. The buy point occurs when the stock breaks out or moves upward through the old point of resistance (right side of the cup).
5. The price target following the breakout can be estimated by measuring the distance from the right top of the cup to the bottom of the cup and adding that number to the buy point. This should be used only as a guideline.
However, we have also seen the failure of Cup & Handle Pattern in the real trades. For example, EURUSD in June 2020 (15 mins Time Frame) showed exactly the opposite story; expectations were for higher side but it could not give a breakout and the price fall drastically.
Inverted Cup & Handle Pattern:
The reverse cup and handle pattern is an upside-down cup followed by a handle and a breakout to the downside. It represents a bearish continuation pattern. The pattern is formed by a drop, a rally, then another drop back to where the rally started. A handle forms, which should be less than a third the size of the cup.
Important Point!
Some traders make the mistake of assuming that once a U-shape forms, the price will drop to form a handle. It may not, so one should ideally avoid trading the pattern until it has fully formed, in order to confirm the trend.
If You Like this idea or have any suggestion, please do comment.
Thank you !
CAP AND HANDLE PRICE ACTION PATTERNThe Cup with Handle is a bullish continuation pattern that marks a consolidation period followed by a breakout.
The cup and handle pattern occurs in both small time frames , like a one-minute chart, and in large time frames , like daily, weekly, and monthly charts. It occurs when there is a price wave down, followed by a stabilizing period, followed by a rally of approximately equal size to the prior decline. It creates a U-shape , or the "cup" in our "cup and handle." The price then moves sideways or drifts downward within a channel—that forms the handle. The handle may also take the form of a triangle.
The handle needs to be smaller than the cup. The handle should not drop into the lower half of the cup , and ideally, it should stay in the upper third.
As its name implies, there are two parts to the pattern: the cup and the handle. The cup forms after an advance and looks like a bowl or rounding bottom. As the cup is completed, a trading range develops on the right-hand side and the handle is formed. A subsequent breakout from the handle's trading range signals a continuation of the prior advance.
A cup and handle chart may signal either a reversal pattern or a continuation pattern. A reversal pattern occurs when the price is in a long-term downtrend, then forms a cup and handle that reverses the trend and the price starts rising. A continuation pattern occurs during an uptrend; the price is rising, forms a cup and handle, and then continues rising.
Entering a Cup and Handle Trade
Wait for a handle to form. The handle often takes the form of a sideways or descending channel or a triangle. Buy when the price breaks above the top of the channel or triangle. When the price moves out of the handle, the pattern is considered complete, and the price is expected to rise.
While the price is expected to rise, that doesn't mean it will. The price could rise a little and then fall, it could move sideways, or it could fall right after entry. For this reason, a stop-loss is needed.
Picking a Target or Profitable Exit
Whatever the height of the cup is, add that height to the breakout point of the handle. That figure is the target. For example, if the cup forms between $100 and $99, and the breakout point is $100, the target is $101.
Sometimes the left side of the cup is a different height than the right. Use the smaller height, and add it to the breakout point for a conservative target. Or use the larger height for an aggressive target.
A Fibonacci extension indicator may also be used. Draw the extension tool from the cup low to the high on the right of the cup, and then connect it down to the handle low. The one-level, or 100%, represents a conservative price target, and 1.618, or 162%, is a very aggressive target. Therefore, targets can be placed between one and 1.618.
If you're day trading and the target is not reached by the end of the day, close the position before the market closes for the day. A trailing stop-loss may also be used to get out of a position that moves close to the target but then starts to drop again.
Setting a Stop-Loss
A stop-loss order gets a trader out of a trade if the price drops, instead of rallying, after buying a breakout from the cup and handle formation. The stop-loss serves to control risk on the trade by selling the position if the price declines enough to invalidate the pattern
Place a stop-loss below the lowest point of the handle. If the price oscillated up and down a number of times within the handle, a stop-loss might also be placed below the most recent swing low.
Since the handle must occur within the upper half of the cup, a properly placed stop-loss should not end up in the lower half of the cup formation.
If the stop-loss is below the half-way point of the cup, avoid the trade. Ideally, the stop-loss should be in the upper third of the cup pattern.
By having the handle and stop-loss in the upper third (or upper half) of the cup, the stop-loss stays closer to the entry point, which helps improve the risk-reward ratio of the trade. The stop-loss represents the risk portion of the trade, while the target represents the reward portion.
Considerations
Traditionally, the cup has a pause, or stabilizing period, at the bottom of the cup, where the price moves sideways or forms a rounded bottom. It shows the price found a support level and couldn't drop below it. It helps improve the odds of the price moving higher after the breakout.
A V-bottom, where the price drops and then sharply rallies may also form a cup. Some traders like these types of cups, while others avoid them. Those that like them see the V-bottom as a sharp reversal of the downtrend, which shows buyers stepped in aggressively on the right side of the pattern. Opponents of the V-bottom argue that the price didn't stabilize before bottoming, and therefore, the price may drop back to test that level. Ultimately, if the price breaks above the handle, it signals an upside move.
If the trend is up, and the cup and handle forms in the middle of that trend, the buy signal has the added benefit of the overall trend. In this case, look for a strong trend heading into the cup and handle. For additional confirmation, look for the bottom of the cup to align with a longer-term support level, such as a rising trend-line or moving average.
If the cup and handle forms after a downtrend, it could signal a reversal of the trend. To improve the odds of the pattern resulting in a real reversal, look for the downside price waves to get smaller heading into the cup and handle. The smaller down waves heading into the cup and handle provide evidence that selling is tapering off, which improves the odds of an upside move if the price breaks above the handle.
Trend: To qualify as a continuation pattern, a prior trend should exist. Ideally, the trend should be a few months old and not too mature. The more mature the trend, the less chance that the pattern marks a continuation or the less upside potential.
Cup: The cup should be “U” shaped and resemble a bowl or rounding bottom. A “V” shaped bottom would be considered too sharp of a reversal to qualify. The softer “U” shape ensures that the cup is a consolidation pattern with valid support at the bottom of the “U”. The perfect pattern would have equal highs on both sides of the cup, but this is not always the case.
Cup Depth: Ideally, the depth of the cup should retrace 1/3 or less of the previous advance. However, with volatile markets and over-reactions, the retracement could range from 1/3 to 1/2. In extreme situations, the maximum retracement could be 2/3, which conforms with Dow Theory.
Handle: After the high forms on the right side of the cup, there is a pullback that forms the handle. Sometimes this handle resembles a flag or pennant that slopes downward, other times it is just a short pullback. The handle represents the final consolidation/pullback before the big breakout and can retrace up to 1/3 of the cup's advance, but usually not more. The smaller the retracement, the more bullish the formation and significant the breakout. Sometimes it is prudent to wait for a break above the resistance line established by the highs of the cup.
Duration: The cup can extend from 1 to 6 months, sometimes longer on weekly charts. The handle can be from 1 week to many weeks and ideally completes within 1-4 weeks.
Volume: There should be a substantial increase in volume on the breakout above the handle's resistance.
Target: The projected advance after breakout can be estimated by measuring the distance from the right peak of the cup to the bottom of the cup.

BASF India - Triangle Breakout Long in a RangeNSE:BASF is currently setting up for a triangle breakout within a range.
It is showing a potential Cup and Handle setup.
However, its recent support from fib. retracement might help it in breaking that range.

MCDOWELL CUP HANDLE PATTERNmcdowell form a cup handle pattern 726 is the tgt in next 45 days
Please do ur own analysis before trade.
This is only for education purpose.
I am not responsible for any type of losses or Gain.


