GBP_USD RISING SUPPORT AHEAD|LONG|
✅GBP_USD is going down now
But a strong rising support level is ahead
Thus I am expecting a rebound
And a move up towards the target of 1.3600
LONG🚀
✅Like and subscribe to never miss a new idea!✅
Disclosure: I am part of Trade Nation's Influencer program and receive a monthly fee for using their TradingView charts in my analysis.
#gbpusd#forex

GBP/USD Drop: Something Big BrewingGBP/USD is cratering, hitting 1.3550 as weak UK economic data and a soaring dollar dominate. Markets look grim with supports shattered. A liquidity drop could trigger wild swings and wider spreads. Global news adds heat: Trump’s 35% tariff threats on Canada and BRICS nations stir trade war fears, crushing GBP. Stay alert, tighten risk.

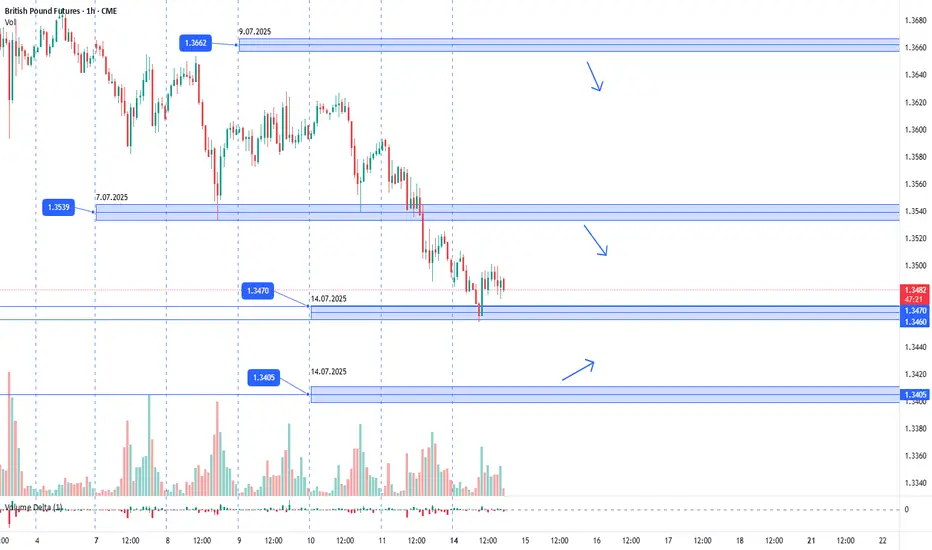
GBPUSD. 14.07.2025. The plan for the next few days.The nearest interesting resistance zone was already worked out in the morning and gave a good reaction. Let's mark the others where we can expect a reaction. It's not certain that there will be a major reversal, but I think we'll see a correction that can be monetized. We're waiting for a reaction and looking for an entry point.
The post will be adjusted based on any changes.
Don't forget to click on the Rocket! =)
GBP-USD Swing Long! Buy!
Hello,Traders!
GBP-USD is trading in a
Long-term uptrend along
The rising support support
Line and the pair will soon
Hit it and from there we will
Be expecting a bullish
Rebound on Monday
Buy!
Comment and subscribe to help us grow!
Check out other forecasts below too!
Disclosure: I am part of Trade Nation's Influencer program and receive a monthly fee for using their TradingView charts in my analysis.

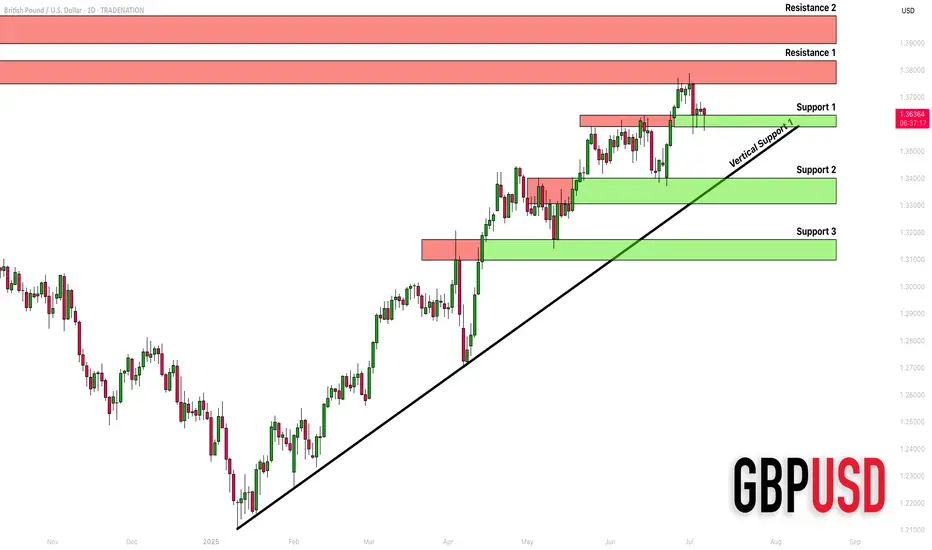
GBPUSD: Detailed Support & Resistance Analysis 🇬🇧🇺🇸
Here is my structure analysis for GBPUSD.
Horizontal Structures
Support 1: 1.3588 - 1.3633 area
Support 2: 1.3305 - 1.3400 area
Support 3: 1.3097 - 1.3175 area
Resistance 1: 1.3748 - 1.3835 area
Resistance 2: 1.3900 - 1.3400 area
Vertical Structures
Vertical Support 1: rising trend line
Consider these structures for pullback/breakout trading.
❤️Please, support my work with like, thank you!❤️
I am part of Trade Nation's Influencer program and receive a monthly fee for using their TradingView charts in my analysis.
Forex. Orderflow. [30.06--04.07]Covering forex pairs. Thoughts and weekly runs and GJ for possible expansion next week
Having a sore throat bear with that

GBP_USD WILL KEEP GROWING|LONG|
✅GBP_USD broke the key structure level of 1.3620
While trading in an local uptrend
Which makes me bullish biased
And I think that after the retest of the broken level is complete
A rebound and bullish continuation will follow
LONG🚀
✅Like and subscribe to never miss a new idea!✅
Disclosure: I am part of Trade Nation's Influencer program and receive a monthly fee for using their TradingView charts in my analysis.

Waiting for Pullback at Green Support GBP/USD Forex Update – Waiting for Pullback at Green Support 📈
GBP/USD is currently in an uptrend. One option is to wait for a pullback to the green support zone level, where buyers could step in and push the price back up again. 📊

GBPUSD – Bullish Structure Holds, Waiting for a Clean RetestGBPUSD recently bounced strongly from the ascending trendline and hit resistance at 1.36300. The price is now slightly correcting, with a high probability of retesting the 1.35000 support zone – an area of FVG and technical confluence.
The bullish structure remains intact as long as price holds above this level. Positive UK Services PMI data further supports the medium-term uptrend.
Are you waiting for the pullback to jump in?

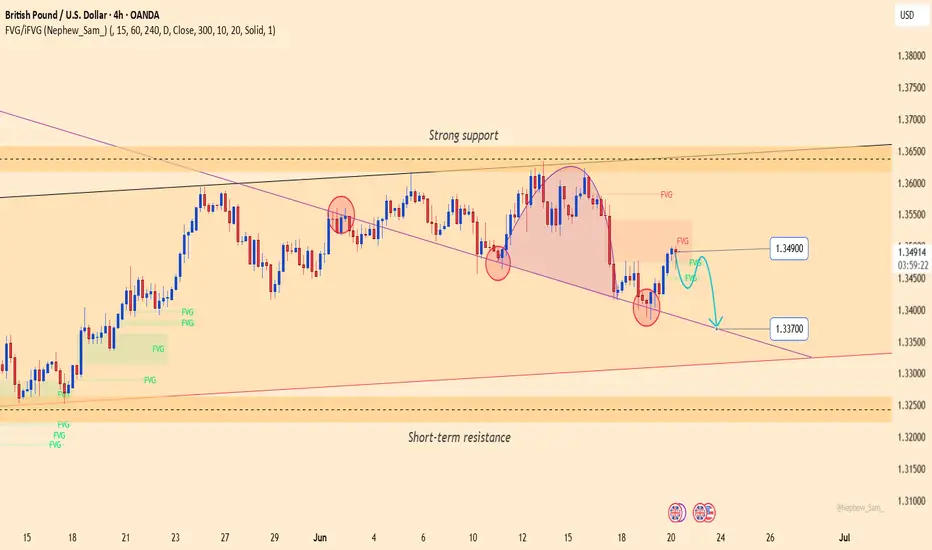
GBPUSD: Bearish pressure persistsGBPUSD is consolidating below a key medium-term resistance zone, with a rounding top and a minor head-and-shoulders pattern forming. The price is currently retesting the Fair Value Gap near 1.34900 — a potential reversal zone if it fails to break higher.
On the fundamental side, the Bank of England's decision to hold interest rates on June 19 disappointed the market. Meanwhile, the US dollar remains supported by safe-haven demand and the Federal Reserve’s hawkish tone, adding further pressure on GBP.
If GBPUSD fails to hold the trendline support near 1.33700, the risk of a deeper decline increases. Both the technical structure and macro fundamentals favor the bears.
GBPUSD hit its 1D MA50. Perfect buy signal.The GBPUSD pair has been trading within a Channel Up pattern since the January 13 2025 market bottom. Yesterday it hit its 1D MA50 (blue trend-line) for the first time since April 08.
This is the most efficient buy entry as the 1D MA50 has been supporting since the February 13 break-out. Even the 1D CCI turned oversold and rebounded, which is consistent with all bottom buys inside the Channel Up.
The Bullish Leg can extend to as high as +5.05% but due to the presence of the Inner Higher Highs trend-line, we first target 1.3850 (+3.43% rise).
-------------------------------------------------------------------------------
** Please LIKE 👍, FOLLOW ✅, SHARE 🙌 and COMMENT ✍ if you enjoy this idea! Also share your ideas and charts in the comments section below! This is best way to keep it relevant, support us, keep the content here free and allow the idea to reach as many people as possible. **
-------------------------------------------------------------------------------
💸💸💸💸💸💸
👇 👇 👇 👇 👇 👇

GBP-USD Swing Long! Buy!
Hello,Traders!
GBP-USD is trading in an
Uptrend along the strong
Long-term rising support
So after the pair falls down
To retest the rising support
We will be expecting a
Bullish rebound and a move up
Buy!
Comment and subscribe to help us grow!
Check out other forecasts below too!
Disclosure: I am part of Trade Nation's Influencer program and receive a monthly fee for using their TradingView charts in my analysis.

GBP-USD Bearish Breakout! Sell!
Hello,Traders!
GBP-USD made a bearish
Breakout of the rising support
Which is a resistance now and
The breakout is confirmed
So we are bearish biased
And we will be expecting
A further bearish move down
Sell!
Comment and subscribe to help us grow!
Check out other forecasts below too!
Disclosure: I am part of Trade Nation's Influencer program and receive a monthly fee for using their TradingView charts in my analysis.

GBP/USD eases off highs again after poor UK dataAfter an initial tumble to just shy of 1.3450 in response to this morning’s disappointing UK jobs and wages print, the pound staged a spirited recovery, climbing back to a high of 1.3536. However, that rebound appears to be fading, with sterling once again drifting lower as the US dollar finds its footing across the board.
The underwhelming labour market data has bolstered expectations for a Bank of England rate cut in August, with a second move potentially on the cards in November, should incoming data allow. With rate cut probabilities on the rise, the pound’s four-month rally could be running out of steam.
June remains in positive territory for GBP/USD, which raises the prospect of a fifth consecutive monthly gain. But that run may be living on borrowed time. Any further deterioration in UK data—or even a modest pick-up in risk appetite favouring the dollar—could well tip the scales back in favour of the greenback.
From a technical standpoint, cable is beginning to look somewhat top-heavy. The key support zone between 1.3430 and 1.3450 has held up thus far, but a clean break below this region would mark a bearish shift in sentiment. Should that occur, a retreat towards the low 1.30s could swiftly come back into play.
By Fawad Razaqzada, market analyst with FOREX.com

GBPUSDHello Traders! 👋
What are your thoughts on GBPUSD?
On the 4-hour timeframe, GBPUSD has broken below its ascending trendline and is now trading below a key resistance zone.
We expect the pair to consolidate briefly within this area, and then move lower toward the specified support level.
As long as the price remains below the resistance and the broken trendline, the bearish bias remains valid.
Don’t forget to like and share your thoughts in the comments! ❤️
GBPUSD is relatively stable, main uptrendOANDA:GBPUSD performed relatively steady among major currencies. The UK's avoidance of Trump's new steel and aluminum tariffs supported the pound and market sentiment remained relatively upbeat.
The UK releases April GDP and employment data this week, and markets are paying close attention. If the unemployment rate rises, that could drag the pound down; if it shows a healthy labour market, that could push it higher.
Bank of England Governor Bailey said he would continue to adopt a “gradual and cautious” interest rate cut strategy, reflecting a cautious stance amid heightened market volatility. The statement was interpreted by the market as hawkish, which helped support the pound. Britain is not a target of Trump’s new tariff policy, and the market believes that the US-UK trade relationship is relatively friendly, which has boosted the British stock market and the pound.
The fact that the UK is not affected by Trump’s steel and aluminium tariffs is a positive for the pound, but this week’s jobs data will be key. If unemployment rises in April, it could undermine sterling’s gains. The market is positive about the Bank of England’s cautious monetary policy stance, believing that this will help the pound maintain its strength in the short term.
On the daily chart, OANDA:GBPUSD is temporarily capped by the 1.35877 price level of the 0.618% Fibonacci extension and the overall technical outlook remains overwhelmingly bullish.
Key supports are seen by the rising price channel and the EMA21, while the bullish RSI has yet to reach overbought levels, suggesting that there is still plenty of room for GBP/USD to move higher in terms of momentum. As long as GBP/USD remains within the price channel, it will remain bullish in the short term, and once GBP/USD breaks above 1.35911, which is the nearest horizontal resistance, it will be eligible to continue its technical rise towards the next target around 1.37104 in the short term.
During the day, the bullish outlook of GBP/USD will be noticed by the following technical positions.
Support: 1.35015 – 1.34441
Resistance: 1.35877 – 1.35911

GBP_USD SWING BREAKOUT|SHORT|
✅GBP_USD was trading in an
Uptrend along the rising support
But now this support is broken
And the breakout is confirmed
So we are bearish biased
And we will be expecting a
Further bearish move down
SHORT🔥
✅Like and subscribe to never miss a new idea!✅
Disclosure: I am part of Trade Nation's Influencer program and receive a monthly fee for using their TradingView charts in my analysis.

GBP-USD Local Long! Buy!
Hello,Traders!
GBP-USD made a bearish
Breakout of the rising support
So we are bearish biased mid-term
But locally the pair will soon
Hit a horizontal support
So we will be expecting a
Rebound and a local move up
Buy!
Comment and subscribe to help us grow!
Check out other forecasts below too!
Disclosure: I am part of Trade Nation's Influencer program and receive a monthly fee for using their TradingView charts in my analysis.

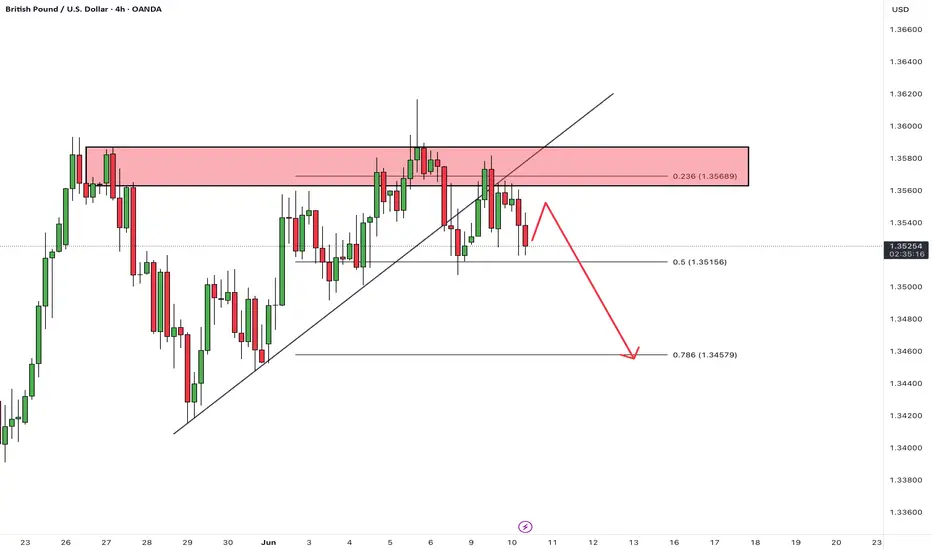
GBPUSD: Potential Reversal After Strong RallyThe British Pound has shown strong gains against the US Dollar, approaching a key resistance area. After such an extended move, a correction or reversal would be a logical expectation.
Technical Setup
There is a clear series of bearish divergences on the CCI (14) indicator. Price is forming a narrowing rising wedge, which often signals trend exhaustion.
Trade Plan
Sell limit orders: 1.3690 and 1.3850
Market entry: Only after confirmation — either a trendline break or a moving average crossover
Conclusion
GBPUSD shows signs of weakening at the top. I remain focused on short setups from resistance areas, waiting for confirmation to act.

GBP-USD Local Short! Sell!
Hello,Traders!
GBP-USD made a retest
Of the horizontal resistance
Of 1.3590 and we are already
Seeing a local pullback so
Despite a counter-trend
Direction of the trade
We will be expecting a
Local move down
Sell!
Comment and subscribe to help us grow!
Check out other forecasts below too!
Disclosure: I am part of Trade Nation's Influencer program and receive a monthly fee for using their TradingView charts in my analysis.

GBP-USD Will Go UP! Buy!
Hello,Traders!
GBP-USD is trading in an
Uptrend and the pair already
Made a rebound from the
Horizontal support level
Around 1.3431 from where
So we are bullish biased
And we will be expecting
A further bullish move up
Buy!
Comment and subscribe to help us grow!
Check out other forecasts below too!
Disclosure: I am part of Trade Nation's Influencer program and receive a monthly fee for using their TradingView charts in my analysis.

GBPUSD - Predictive Analysis & ForecastingGBPUSD
Scales
- S: 1.3169 activation triggers 1.3347 (unless falls to 1.3100)
- M1: 1.3426 activation triggers 1.3131 pivot
- M2: 13555 activation triggers 1.3109
- L: pending at 1.3664
Forecast & Targets
- ST: bearish risk down to 1.3100
- MT: bullish, up to 1.3664
#GBPUSD #Forex #CROW2.0
4xForecaster
------
Originally published on BlueSky

GBP-USD Swing Long! Buy!
Hello,Traders!
GBP-USD is trading in an
Uptrend and the pair made
A retest of the horizontal
Support of 1.3419 from where
We are already seeing a
Bullish rebound so we will be
Expecting a further
Bullish move up
Buy!
Comment and subscribe to help us grow!
Check out other forecasts below too!
Disclosure: I am part of Trade Nation's Influencer program and receive a monthly fee for using their TradingView charts in my analysis.
