ETH on high time frame
"Hello traders, focusing on ETH, the price is currently at a critical level around $2,800, where it has made multiple unsuccessful attempts to break through. On the high time frames, the price has swept liquidity without showing any signs of reversal. This leads me to anticipate a higher price movement, with the next potential level being around $3,400."
If you need further assistance or have any specific questions, feel free to let me know!
1-BTCUSD

BTCUSD - Bear Double Top ScenarioBitcoin is still above the ascending trend line in green however price is looking to form a next high reaching new ATH's
This could lead to resistance at the next top creating a double top, pushing price back down to the ascending trend line. From there if this strong trend line in green breaks it could turn very bearish below that line.
4Hr chart

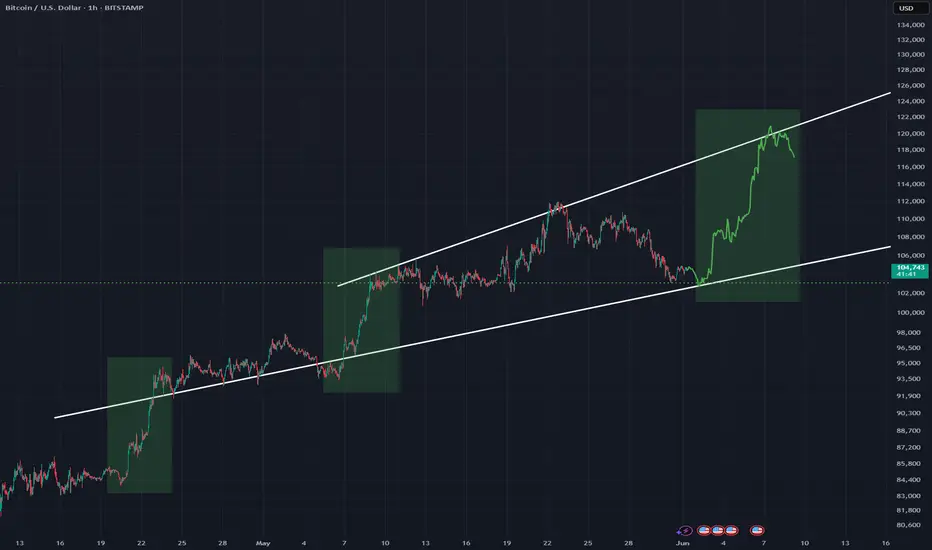
Bullish View #BTC Looking for a third strong wave up within this expanding pattern as price hits support in white
Moves up in green rectangles are similar
Hourly timeframe with the horizontal dotted line as a strong support line
BTC SHORT TP:103,700 31-05-2025🚨 SHORT setup in play
Entry between 104,800 and 105,100, targeting 103,600–103,800 on the 1H chart.
Estimated duration: 6–10 horas ⏳
Esto es solo un rebote bajista en un contexto donde lo grande sigue siendo alza. Si no baja dentro del tiempo estimado, el setup queda invalidado.
We don’t use indicators, we’re not out here drawing lines or cute little shapes — I just give you a clean trade.
#BTC #PriceAction #Reydragon21

GBPJPY update!!Good day traders, I’m back with yet another beautiful setup on GJ and I really wish we can all monitor how price plays out and learn more about price signature.
For this setup I’ll explain more about it after the fact because it’ll help me make my point clearer and easily understandable.
Yet another gift..🎁🧧

Check support: Fibonacci ratio 1.902(101978.54) ~ 2(106178.85)
Hello, traders.
If you "Follow", you can always get the latest information quickly.
Have a nice day today.
-------------------------------------
(BTCUSDT 1M chart)
A new month begins.
The OBV indicator is currently rising again near the High Line.
We need to see if it can continue to rise by breaking above the High Line.
If not, there is a possibility of a decline near the Fibonacci ratio of 1.902 (101978.54) ~ 2 (106178.85).
If it declines with strong trading volume, there is a possibility of a decline near the StochRSI 20 point of 97209.25.
Therefore, we need to respond depending on whether there is support in the Fibonacci ratio of 1.902 (101978.54) ~ 2 (106178.85).
The most important support and resistance area on the current 1M chart is 69000-73499.86.
-
(1D chart)
It is showing a downward trend below the M-Signal indicator of the 1D chart.
Accordingly, the possibility of a short-term downtrend is increasing.
However, as mentioned earlier, the key is whether it can rise with support in the right Fibonacci ratio 1.902 (101978.54) ~ 2 (106178.85) section.
If not, it is likely to fall to around 97226.92.
-
The next volatility period is expected to be around June 6.
Accordingly, the current trend is likely to be maintained until the next volatility period.
In order to turn into an upward trend, the price must rise above the M-Signal indicator of the 1D chart and maintain it.
However, since the HA-High indicator is formed at the point of 108316.90, it is highly likely that the uptrend will begin only when it rises above this point.
Therefore, we need to check if it rises above 108316.90 and receives support.
-
In my chart, the basic trading strategy is to buy near the HA-Low indicator and sell near the HA-High indicator.
However, if it receives support from the HA-High indicator and rises, it is likely to show a stepwise uptrend, and if it receives resistance from the HA-Low indicator and falls, it is likely to show a stepwise downtrend.
The end of the stepwise uptrend is a downtrend, and the end of the stepwise downtrend is an uptrend.
Therefore, in order to establish a buying strategy, we need to meet the HA-Low indicator.
In other words, if the HA-Low indicator is newly created as the price falls, it is important to see whether there is support near it.
-
If it falls below the dotted line indicated on the OBV indicator, it will fall below the previous High Line, so there is a possibility that it will lead to an additional decline.
In particular, if it falls below the Low Line, the price is likely to fall.
However, since the channel of High Line ~ Low Line is still showing an upward trend, I think the overall movement is still maintaining an upward trend.
In order for the channel of High Line ~ Low Line to turn downward, it must fall to the area indicated by the arrow.
-
To summarize the above,
- Check for support in the right Fibonacci ratio 1.902(101978.54) ~ 2(106178.85) section
- The start of the uptrend is when the price rises above 108316.90 and maintains it
- Check for support near 97226.92 in the event of a further decline
- If the HA-Low indicator is newly generated in the event of a further decline, focus on finding the time to buy based on whether there is support near that area
-
Thank you for reading to the end.
I hope you have a successful trade.
--------------------------------------------------
- This is an explanation of the big picture.
(3-year bull market, 1-year bear market pattern)
I will explain more details when the bear market starts.
------------------------------------------------------

Bitcoin Monthly Outlook – Long-Term PerspectiveBitcoin Monthly Outlook – Long-Term Perspective
Regardless of the daily fundamental noise—ranging from institutional interest to global policy shifts—technical analysis also supports the possibility of further growth in Bitcoin over the long term.
Currently, Bitcoin remains in its primary bullish trend and is still moving within a rising channel structure.
Even if a pullback occurs toward the $39,000 level, the overall trend structure would remain intact, and the risk-to-reward ratio could still be considered favorable (approximately 4:1 in this context).
Of course, the market is driven by probabilities, and deeper corrections are always possible. However, both positive news and technical structure continue to signal a potential continuation of the upward movement.
📌 Based on this structure, key long-term support levels to watch are:
$70.000
$50,000
$40,000
📌 This analysis is for educational and informational purposes only and does not constitute financial advice.
📝 Follow for updates and long-term crypto insights.

Bitcoin is nearing a critical breakout zone at $86,000Bitcoin is nearing a critical breakout zone at $86,000.
If this level breaks with strong momentum, we could see a rapid bullish continuation toward the major resistance area around $105,000. The ascending channel remains intact, and aggressive buying near support points to a strong upside setup.
From a fundamental view, Bitcoin is gaining strength as global uncertainty rises. The latest escalation of trade tariffs has disrupted traditional markets, pushing more investors toward alternative assets like Bitcoin. Historically, Bitcoin has performed strongly during times of economic instability.
Tightening monetary policies worldwide are fueling recession fears, making Bitcoin even more attractive as a hedge — the new "digital gold." With institutional interest growing, Bitcoin is well-positioned for a significant capital inflow.
Stay ready — the next big move is close! 🚀

Bitcoin - Ready to go but from lowerAfter breaking out of the marked range, Bitcoin retested the level but is now showing weakness in bullish momentum.
Although the price has broken above the high that created the last lower low, it did so without strong momentum, and is now pulling back.
🔍 We are watching the highlighted zones for potential bullish reactions.
In these areas, we will look for a confirmed long entry trigger.
⚠️ The lower the price drops—especially if it reaches the 4H Fair Value Gap (FVG)—the higher the reward-to-risk ratio for long setups.
Be patient and wait for confirmation before entering. ✅
🔍 Insight by ProfitaminFX
If this outlook aligns with your bias, or if you see it differently, feel free to share your perspective in the comments. Let’s grow together 📈

BTCUSD BREAK SUPPORT LEVEL AND WENT TO DOWN TRENDHere I Created This BTCUSD Chart Analysis
Pair : BTCUSD (BITCOIN)
Timeframe: 1 - Hour
Pattern: Breakout
Momentum: Bearish / Sell
Entry Limit : Sell 106200
Resistance zone : 106600
Target Will Be : 104000
Disclaimer : This signal is based on personal analysis for learning purposes. Trade at your own risk and always use proper risk management.

BTC/USD 4h Char ReviewHello everyone, I invite you to review the current situation on BTC taking into account the 4-hour interval. We can see how the price is maintained just below the upward trend line, while a downward trend channel may be forming locally.
Here you can see how the price decline is maintained in a strong support zone from $ 105,000 to $ 103,150, however, if the support zone is broken, the price may quickly fall to the support area at $ 100,700
Looking the other way, you can see that when the trend reverses, we first have resistance at $ 106,560, the next is at $ 108,590, and then you can see very strong resistance at the level of the last ATH in the area of $ 112,000.
On the MACD indicator and the RSI indicator, you can see how we are maintaining in the lower part of the range, which indicates that the price bounce is still taking place to continue the growth.

SPELLUSDT Forming Bullish Falling WedgeSPELLUSDT is currently exhibiting a bullish falling wedge pattern, a formation that often precedes a significant upward breakout. The price has been gradually compressing between converging trendlines, and recent candles suggest growing bullish pressure near the wedge’s support. With a good volume profile backing this consolidation, the chart structure is lining up for a potential breakout that could yield a projected gain of 90% to 100% in the near term.
Spell Token (SPELL) powers the Abracadabra.money ecosystem, a DeFi lending protocol that allows users to borrow stablecoins using interest-bearing assets as collateral. As DeFi begins to regain traction in the broader crypto market, SPELL is drawing more investor attention due to its utility and role within a growing protocol. This resurgence in investor interest is aligning well with the technical setup, indicating strong potential for bullish price action.
Technically, a breakout from the falling wedge pattern with sustained volume could confirm the bullish reversal. Once the resistance line is breached, it may trigger an impulsive rally with minimal overhead resistance, creating an ideal scenario for swing traders and short-term investors targeting explosive moves. The projected upside from the current pattern breakout points toward levels not seen since previous local highs, reinforcing a bullish narrative.
In summary, SPELLUSDT is showing strong signs of a trend reversal with an ideal bullish chart pattern and healthy volume. The convergence of technical indicators, pattern formation, and growing market interest sets the stage for a potential high-reward setup in the coming weeks.
✅ Show your support by hitting the like button and
✅ Leaving a comment below! (What is You opinion about this Coin)
Your feedback and engagement keep me inspired to share more insightful market analysis with you!

BTC Correction - 50%After completing the impulse and falling out of the channel, Bitcoin most likely went into a correction

BTCUSD Bearish Signal | Technical + Custom AlgoSmart Trend Signal | Technical Analysis + Custom Algorithm
This signal is the result of a combination of classic technical trend analysis and a proprietary software I personally developed.

BITCOIN Bearish Signal | Technical + Custom AlgoSmart Trend Signal | Technical Analysis + Custom Algorithm
This signal is the result of a combination of classic technical trend analysis and a proprietary software I personally developed.

BTCUSD HTF cycle analysis
Hi, I’m from Phoenix FX, and today I’ll be sharing my perspective on Bitcoin (BTC) price action based on the higher timeframes.
I’ll also give you my outlook on potential trade setups for today and tomorrow. Please remember that this is not financial advice—use this information as a guide only. If you find it helpful, don’t forget to like and share it with your like-minded communities.
Higher Timeframe Analysis
In my view, BTC tends to follow clear bullish and bearish cycle zones. Typically, we see a pump to new all-time highs (ATH), followed by the formation of resistance and a retracement down to a key support level. Our trading approach focuses on identifying those critical support and resistance levels, with some interim trades based on shorter-term analysis—occasionally even counter-trend, depending on the day’s market bias.
Over the past eight years, BTC has respected a major trend resistance line. The most recent ATH, around $112K, reconfirmed the relevance of this trendline. This makes it a valuable tool for projecting future ATH levels.
Looking ahead, I expect a move towards the $115K level in the coming weeks. This would likely act as a point of resistance, at which stage we might see a reversal and a drop back down to a key support zone.
Trade Setup
The chart I'm referencing highlights what I would consider the first premium buy zone, identified using a 4-hour Fair Value Gap (FVG).
The 50% level of this zone sits at $99,450. If this zone fails to hold, we may drop further to the secondary premium buy zone, which aligns with our higher timeframe (HTF) trend support and a weekly FVG. The 50% level of this deeper zone is around $89,150.
A potential long entry at $92,550, with a stop loss around $88,000, offers an excellent risk-to-reward (RR) ratio, targeting a move up to the $115K level.
Intraday Outlook
For today, I see bearish price action, with potential rejection around the $104,300–$105,000 range. Go short around the $104,750 to $105,000 zone
This could lead to a move down toward the lower key zones highlighted in the HTF analysis.
I recommend taking partial profits (TP) at every $1,000 increment and setting your stop loss to breakeven (BE) after hitting the first target.
Final Thoughts
Price action analysis is always subjective, so I’d love to hear your thoughts and ideas in the comments—each one, teach one.
Thanks for giving me some of your time.
From the Phoenix FX team, have a great weekend!

BTCUSD Price action analysis on HTFHi, I’m from Phoenix FX, and today I’ll be sharing my perspective on Bitcoin (BTC) price action based on the higher timeframes.
I’ll also give you my outlook on potential trade setups for today and tomorrow. Please remember that this is not financial advice—use this information as a guide only. If you find it helpful, don’t forget to like and share it with your like-minded communities.
Higher Timeframe Analysis
In my view, BTC tends to follow clear bullish and bearish cycle zones. Typically, we see a pump to new all-time highs (ATH), followed by the formation of resistance and a retracement down to a key support level. Our trading approach focuses on identifying those critical support and resistance levels, with some interim trades based on shorter-term analysis—occasionally even counter-trend, depending on the day’s market bias.
Over the past eight years, BTC has respected a major trend resistance line. The most recent ATH, around $112K, reconfirmed the relevance of this trendline. This makes it a valuable tool for projecting future ATH levels.
Looking ahead, I expect a move towards the $115K level in the coming weeks. This would likely act as a point of resistance, at which stage we might see a reversal and a drop back down to a key support zone.
Trade Setup
The chart I'm referencing highlights what I would consider the first premium buy zone, identified using a 4-hour Fair Value Gap (FVG).
The 50% level of this zone sits at $99,450. If this zone fails to hold, we may drop further to the secondary premium buy zone, which aligns with our higher timeframe (HTF) trend support and a weekly FVG. The 50% level of this deeper zone is around $89,150.
A potential long entry at $92,550, with a stop loss around $88,000, offers an excellent risk-to-reward (RR) ratio, targeting a move up to the $115K level.
Intraday Outlook
For today, I see bearish price action, with potential rejection around the $104,300–$105,000 range. Go short around the $104,750 to $105,000 zone
This could lead to a move down toward the lower key zones highlighted in the HTF analysis.
I recommend taking partial profits (TP) at every $1,000 increment and setting your stop loss to breakeven (BE) after hitting the first target.
Final Thoughts
Price action analysis is always subjective, so I’d love to hear your thoughts and ideas in the comments—each one, teach one.
Thanks for giving me some of your time.
From the Phoenix FX team, have a great weekend!

Bitcoin Analysis: Elliott Wave Correction to $90K as the First SI am assuming that in the Bitcoin chart, in the best-case scenario— which would be the most sustainable and long-term favorable outlook—we are currently in a BCWX and Y correction pattern that will bring us back to around $50,000. This scenario is marked on the chart with , {W} {X} {Y}, and the intermediate steps are indicated in yellow as i, ii, iii, iv, v (a), (b), (c).
Within this structure, I expect a diagonal triangle labeled as a, b, c, d, e after the completion of (c). Following this, I anticipate a wave (w), which is subordinate to {W} and {X}. After completing wave (w), I expect a corrective move characterized by an ABC pattern leading into WX and Y waves. During this process, I also foresee an expansion of wave Y (x). Once this movement concludes, I will update the chart accordingly and provide a new analysis based on this second scenario.
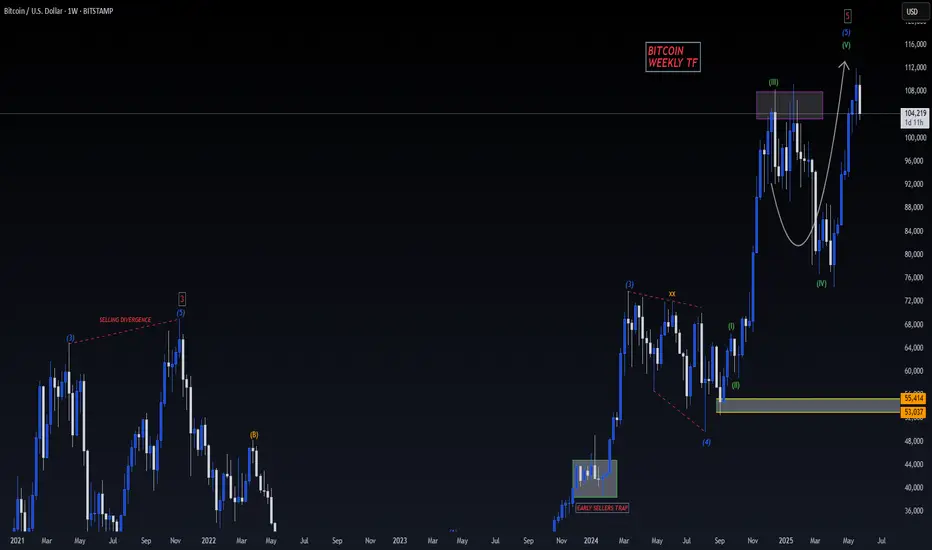
The second scenario is less optimistic for Bitcoin's long-term prospects but could be more favorable in the short term. In this case, we are currently at , which I interpret as an upward impulse marked with (i), (ii), (iii), (iv), (v). After completing wave (v) near $111K, we would then see a correction down to approximately $90K before initiating wave (II).
This correction would be necessary to establish a sustainable bullish trend afterward. Only then could we expect a strong upward movement again.
This is my current chart and analysis. I am sharing it with you all; please note that there are no guarantees when entering such trades—your decision to act on this analysis is entirely your own.

BITCOIN BULLISH TO $116,000 (UPDATE)Bitcoin has come very close to our $116,000 target, peaking at $112,000 just $4,000 away from our TP.
I still believe BTC prices will push higher for sure. But my only concern right now is will BTC have a huge correction ( Minor Wave 4) before it moves back up again? If it does then I'll most likely cash out my buy positions soon for my Crypto Fund investors, as we've already made decent profits & it is not worth holding on too much longer & risking it.

BTCUSDT Hello traders, wishing everyone a great weekend!
I’ve identified a sell opportunity on BTCUSDT and decided to share it with you as well.
🔍 Trade Details:
✔️ Timeframe: 15-Minute
✔️ Risk-to-Reward Ratio: 1:2 / 1:4
✔️ Trade Direction: Sell
✔️ Entry Price: 103,826.28
✔️ Take Profit: 103,428.15
✔️ Stop Loss: 104,025.48
🔔 Disclaimer: This is not financial advice. I’m simply sharing a trade I’ve taken based on my personal trading system, strictly for educational and illustrative purposes.
📌 Interested in a systematic, data-driven trading approach?
💡 Follow the page and turn on notifications to stay informed about upcoming trade ideas and advanced market insights.

No breakout. Just engineered liquidity. Watch how I step in.This setup didn’t need noise. Just clarity.
We took sell-side liquidity below the FVG FF with precision, tapping into a 4H OB nested at a deeper 78.6% retracement. That’s where the mispricing ends. That’s where I step in.
Price didn’t reverse because of “oversold.” It reversed because Smart Money engineered the imbalance, swept stops, and delivered into a value zone. Nothing more. Nothing less.
The rejection from that 102,067 level formed the base. From there, I expect delivery up into the 104,953 handle — where the 0.618 confluence and the upper OB sit. That’s the decision point.
Above that, we’ve got unfinished business at 107,614. If price pierces through 106,955 — where the 0.5 lines up with a previous supply — expect the full expansion into the 109,500s.
But I’m not rushing it. Liquidity above that OB at 108,122 has weight — and may serve as distribution before another push lower.
What I’m watching:
✅ Buy-side liquidity resting above 104,953
✅ OB rejection zone at 108,122
❌ 102,067 invalidation if price closes with displacement through the low
🔻 If that fails — price wants the inefficiency down near 102,051
I’m not here to catch every move.
I’m here to catch the right one.
I don’t need confirmation. I am the confirmation.

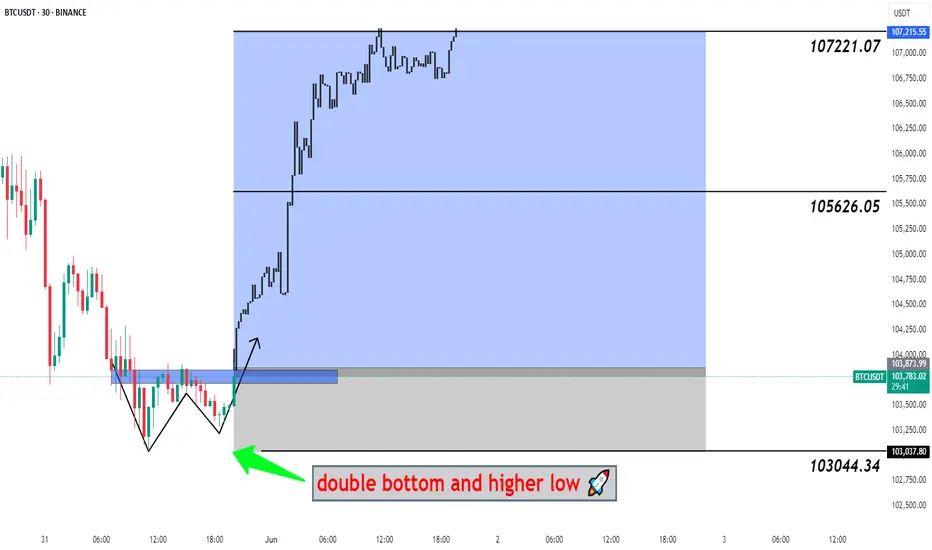
#BTCUSDT Big Pump Next Hour - Bitcoin, BTCUSD, BTCUSDT 📉 Double Bottom Pattern Forming – Potential Reversal Setup
The current price structure is showing signs of a Double Bottom – a classic bullish reversal pattern. After an extended downtrend, this pattern suggests that the market may be preparing for a trend reversal from this key demand zone.
🔹 Trade Setup
Entry, Targets, and Stop Loss (SL) are marked on the chart.
Entry: Upon breakout confirmation above the neckline.
Stop Loss: Just below the recent swing low to manage downside risk.
Targets: Calculated using the measured move method from the bottom to the neckline .
🔹 Risk & Money Management (Professional Approach)
To maintain consistent profitability and protect capital, strict risk management is essential. For this setup:
🔸 Position Sizing: Based on a fixed % of total capital (typically 1–2% of account equity per trade).
🔸 Risk-to-Reward Ratio: Minimum of 1:2, ideally higher.
🔸 Stop Loss Discipline: No arbitrary changes after entry. SL only adjusted for breakeven or trailing stops once price moves favorably.
🔸 Trade Management: Secure partial profits at key levels, trail stops as structure forms.
🔸 Capital Allocation: Avoid overexposure. Trade fits within overall portfolio strategy.
💬 Let the setup come to you. React, don’t predict.
🔁 Like, comment, or share your thoughts below!
BINANCE:BTCUSDT BITSTAMP:BTCUSD COINBASE:BTCUSD BINANCE:BTCUSDT.P INDEX:BTCUSD CRYPTOCAP:BTC.D CRYPTO:BTCUSD BYBIT:BTCUSDT.P BINANCE:BTCUSD