BTC/USD – Double Top Breakdown Signals Bearish Wave- 4H chart. 🧨
🔍 Chart Analysis:
🟢 Recent Price Action:
Bitcoin formed a double top pattern near the Recent All-Time High (ATH) 📈 — a strong bearish signal 🔔.
A trendline break occurred right after the second peak, confirming potential weakness ⚠️.
🟠 Supply Zone:
Price re-entered a previous supply zone (resistance area) and failed to hold above it 🧱 — indicating sellers are active again.
🔵 EMA 70 (Blue Line):
The price has dropped below the 70 EMA, signaling momentum shift from bullish to bearish 📉.
🔴 STOP LOSS ZONE:
Positioned above 110,555 🚫 — risk level for this short setup if bulls reclaim control.
🟡 Bearish Pathway (Expected Move):
Price may retest the broken zone 🔁.
Followed by a sharp drop to the 1st support near $101,503 🎯.
Confirmed by large bearish volume spikes 📊.
💥 Trade Idea:
Entry: Near 106,000 (on retest of supply zone).
Stop Loss: Above 110,555 🔺.
Target: $101,500 🎯.
Risk/Reward Ratio: 🔥 Favorable setup for swing short sellers!
📛 Pattern Breakdown:
⚠️ Double Top = Reversal Signal.
🔻 Trendline Break = Shift in Market Structure.
🧊 Supply Zone Rejection = Bearish Confirmation.
1-BTCUSD

BTCUSD: Bullish Continuation & Long Trade
BTCUSD
- Classic bullish setup
- Our team expects bullish continuation
SUGGESTED TRADE:
Swing Trade
Long BTCUSD
Entry Point - 10465
Stop Loss - 10321
Take Profit - 10794
Our Risk - 1%
Start protection of your profits from lower levels
Disclosure: I am part of Trade Nation's Influencer program and receive a monthly fee for using their TradingView charts in my analysis.
❤️ Please, support our work with like & comment! ❤️

Technical Note on BTC/USDBearish bias in the short term unless the price breaks and holds above the resistance.
• Monitor volume and structure on the breakdown to confirm momentum.
• Key levels to watch: Resistance ~109,000, Support ~104,000–104,500.
BINANCE:BTCUSDT

BTC/USD 4H Trade Setup – Demand Zone Reversal Play🔵 1. Demand Zone 🧲💎
📍 Range: 100,418.83 – 102,253.51
🟦 Strong support zone
💡 This is where buyers are expected to step in
📉 Price is currently testing this zone — potential reversal area
🚀 2. Entry Point 🎯
📍 Zone: 102,232.52 – 102,264.33
✅ Just above demand zone for safe entry
🧘♂️ Wait for bullish confirmation (wick rejections, engulfing candles)
🛑 3. Stop Loss 🔻
📍 Zone: 100,498.77 – 100,538.74
🔒 Below demand zone — protects you from false breakouts
⛔ Invalidates setup if price breaks below this level
🎯 4. Target Point 💰
📍 Target: 108,800.00
🧱 Major resistance zone
📈 Offers a solid Risk/Reward setup (approx. 1:4)
🪜 Possible take-profit scaling around 108,656.78 – 109,256.50
🔁 5. CHoCH – Change of Character 🔄
📍 Confirmed structural break above a lower high
🕵️♂️ Indicates shift from bearish to bullish
🔁 Needs confirmation with higher low near demand zone
📏 6. EMA 70 (Exponential Moving Average) 📉
📍 Level: 106,849.30
🔴 Price is currently below EMA = short-term bearish
🧗♂️ Reclaiming the EMA will strengthen the bullish bias
✅ Quick Summary with Emojis
📌 Plan:
🔵 Buy near: 102,250
🛑 Stop Loss: 100,500
🎯 Take Profit: 108,800
📊 Trend:
🔻 Bearish short-term (below EMA)
🔁 Potential reversal from demand zone
⚠️ Watch For:
🔍 Bullish confirmation at demand zone
🔄 Reclaim of EMA (106.8k)
🧱 Resistance near 108.8k

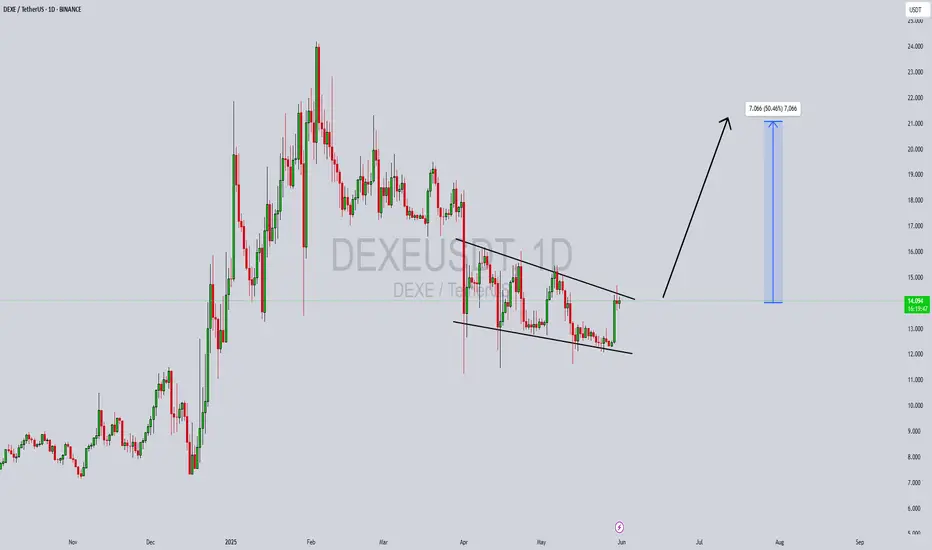
DEXEUSDT Forming a Bullish Wave DEXEUSDT is currently forming a bullish wave pattern, which indicates a strong continuation trend following a previous impulsive move. This technical formation, characterized by a series of higher highs and higher lows, reflects growing investor confidence and buying momentum. With good volume supporting the price structure, the likelihood of a breakout continuation is high, targeting an expected gain of 40% to 50% in the medium term.
DeXe (DEXE) has been gaining traction within the decentralized finance (DeFi) sector. As a governance and staking token for the DeXe network, it offers a unique proposition in decentralized asset and portfolio management. This aligns with the growing demand for transparency and user empowerment in financial decision-making, which enhances its fundamental appeal. The recent bullish wave setup complements this strong narrative, making DEXEUSDT a compelling asset on both technical and fundamental fronts.
From a chartist’s perspective, confirmation of this pattern with a breakout above recent swing highs could attract both momentum and position traders. Supporting indicators such as RSI trending upward and MACD crossover point to increasing bullish strength. The combination of technical alignment and rising on-chain activity for DEXE fuels a high-probability trade setup for bullish continuation.
In conclusion, DEXEUSDT is on the radar of many smart money traders looking to ride the next impulsive leg. If this bullish wave completes as anticipated, we could see significant upside in the coming weeks, especially as DeFi regains momentum across the crypto space.
✅ Show your support by hitting the like button and
✅ Leaving a comment below! (What is You opinion about this Coin)
Your feedback and engagement keep me inspired to share more insightful market analysis with you!
PHAUSDT Forming a Bullish Flag PatternPHAUSDT is currently displaying a classic bullish flag pattern on the daily chart, which is often considered a strong continuation signal in technical analysis. After a sharp upward move, the price has entered a consolidation phase within a descending channel—forming the "flag" portion of the pattern. With good volume backing the previous rally, this consolidation suggests that the bulls are simply taking a breather before the next leg higher. A breakout above the upper boundary of the flag could potentially trigger a 40% to 50% gain in the coming sessions.
From a market sentiment standpoint, PHA is gaining increased traction among crypto investors due to its underlying fundamentals and the growing use case of privacy-preserving technologies. As part of the Phala Network, which focuses on decentralized cloud computing with built-in privacy, the token has positioned itself well in the Web3 and privacy niche. This unique narrative is attracting more attention, and it reflects in the technical setup that's ripe for a breakout.
Traders should closely monitor the breakout zone near the flag's resistance. If PHAUSDT pushes through with strong volume confirmation, it could mark the beginning of a new bullish wave. Price action, along with volume spikes, RSI crossover, and MACD bullish alignment, further support this scenario. The potential risk-to-reward ratio favors strategic long entries for both swing traders and mid-term investors.
This pattern is a compelling opportunity for those looking to capitalize on breakout moves in trending altcoins. If market conditions remain favorable, PHAUSDT could easily exceed expectations, offering a solid gain for those positioned early.
✅ Show your support by hitting the like button and
✅ Leaving a comment below! (What is You opinion about this Coin)
Your feedback and engagement keep me inspired to share more insightful market analysis with you!

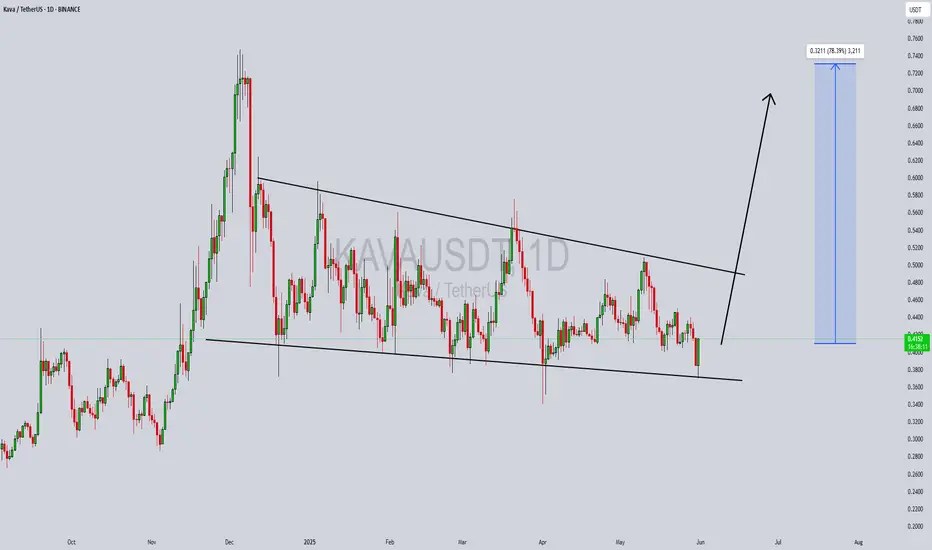
KAVAUSDT Forming a Bullish WaveKAVAUSDT is currently presenting a strong bullish wave pattern formation on the daily timeframe, hinting at a potential continuation of the upward trend. After a period of consolidation, KAVA has started to push higher with increasing bullish momentum. This movement is accompanied by solid volume, suggesting that the current wave could be the beginning of a larger impulse leg. The structure is favorable for swing traders and position traders looking to capture mid-term gains in the range of 60% to 70% or more.
From a technical perspective, the price has respected key support zones and is now forming higher highs and higher lows—a classic sign of a bullish trend in development. The overall market sentiment around KAVA is improving, and this is reflected in its rising trading volumes and increased mentions across crypto discussion platforms. If the bullish wave continues to unfold as expected, KAVA could challenge previous resistance levels and break into a new bullish phase.
KAVA also benefits from growing investor interest due to its strong fundamentals in the DeFi ecosystem. As a cross-chain DeFi platform, KAVA provides lending and stablecoin services, making it an attractive asset in a maturing crypto market. Technical indicators such as RSI and MACD are showing bullish signals, further supporting the case for a significant upside move. With volume surging and structure aligning, KAVA appears well-positioned to deliver a strong breakout rally.
Keep an eye on price levels around recent breakout zones as potential entry points. A successful retest could provide a good risk-reward setup for traders aiming to ride the bullish wave. Continued buying pressure and sustained volume would be key signs of strength in the coming days.
✅ Show your support by hitting the like button and
✅ Leaving a comment below! (What is You opinion about this Coin)
Your feedback and engagement keep me inspired to share more insightful market analysis with you!
BTC on high time frame
"Hello traders, focusing on BTC on high time frames, the $102,000 level (referred to as the vector level) is crucial for price action. If the price convincingly breaches and closes below this level on the 4-hour or higher time frames, it suggests a potential move to the downside.
However, if the price merely sweeps liquidity and forms shadows on the high time frames without closing below the critical level, it indicates the potential for further upward momentum towards new higher highs."
If you have any more details to add or need further assistance, feel free to let me know!

BTC Correction's 📉 Significant Bitcoin Correction During Uptrend
After a strong bullish rally, Bitcoin has entered a correction phase, retracing nearly 25% of its recent gains. Interestingly, this correction aligns exactly with the 200-period moving average on the 4-hour chart, marking a potential key support level.
🔍 Is Bitcoin’s Correction Over or Just Beginning?
The overlap with the 200 MA could signal the end of the correction, but if this zone fails to hold, deeper targets between the 35% and 75% retracement levels may come into play.
🛡️ Potential Support Levels for Bitcoin if the Correction Continues:
First support: 102,200 USD – 25% correction
Second support: 93,200 USD – 35% correction
Third support: 84,100 USD – 50% correction
Fourth support: 74,600 USD – 75% correction

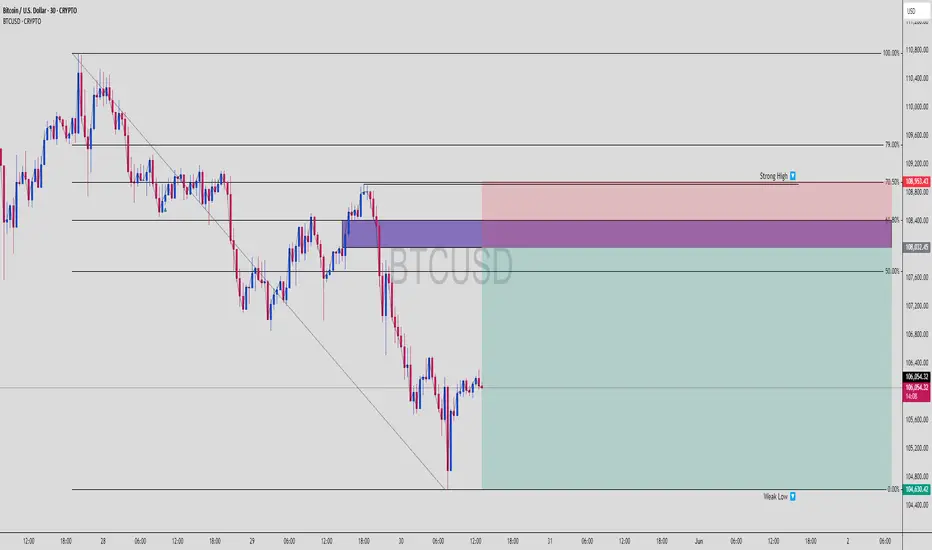
BTCUSD SMC Short | 70.5% Fib + OB Rejection Incoming?BTCUSD | High Risk-Reward Setup at Key Supply Zone 🔥
This Bitcoin setup is setting up for a potential clean short opportunity, right from a key Order Block zone confluenced with 61.8–70.5% Fib retracement and a Strong High liquidity magnet above.
🧠 1. Why This Trade Setup is 🔥
This BTCUSD chart shows Smart Money preparing a trap:
🔺 Impulse down ➝ forming market structure shift
📉 Retracement back to a refined OB (purple zone)
📍 Aligned perfectly with:
✅ 61.8–70.5% Fib retracement zone
✅ Strong High = liquidity trap
✅ Bearish engulfing rejection from supply zone
This is textbook SMC confluence. Price could sweep the high one more time, then tank hard.
📌 2. Zone Breakdown
OB Entry Zone (purple): ~108,000 to 108,400
SL Above Strong High: ~109,000
TP at Weak Low: ~104,600
✅ Entry around 108,000
✅ RRR: ~1:5 👑
📈 3. Market Structure
HTF Bias: Bearish
LTF Structure: Retracing to premium zone
Expecting BOS downward if rejection confirms
⚙️ 4. Trade Plan
Wait for price to tap 61.8–70.5% zone
Look for M5/M15 bearish structure break
Enter on pullback to M15 OB
SL = Above the High
TP = Weak Low (104,630)
🛑 5. Risk Management Tips
Never enter blindly at 61.8%
Always wait for confirmation on LTF (M5/M15)
If price blows past 70.5%, let it go — don’t chase 🧘
🧠 Save this trade plan
📈 Comment “BTC SMC ENTRY” if you caught this
👀 Follow for more Smart Money chart breakdowns
Bitcoin's at ALL TIME HIGHS and I'm going ALL IN!!As Bitcoin surges to new all-time highs, I've made a pivotal decision: to stop saving in dollars and start holding Bitcoin.
Why Bitcoin? Self-Custody:
Owning Bitcoin means true ownership. With self-custody, I control my private keys, ensuring my wealth isn't subject to third-party risks like bank failures or government seizures.
Declining Dollar Value: The U.S. dollar continues to depreciate due to inflation and economic policies. Holding Bitcoin, a deflationary asset, offers a hedge against this erosion of purchasing power.
Global Accessibility: Bitcoin transcends borders, providing financial inclusion for anyone with internet access, especially in regions with unstable currencies.
Security and Privacy: With proper self-custody practices, my Bitcoin holdings are secure from hacks and offer enhanced privacy compared to traditional financial systems.
As I monitor the BTC/USD daily chart, the trend is clear: Bitcoin isn't just a speculative asset; it's a movement towards financial sovereignty.

$DOGE At Key Support Reversal Ahead?The DOGEUSDT 1D chart shows price testing a strong support zone around $0.18–$0.19.
If this level holds, a bullish reversal could push DOGE toward the $0.32 resistance area.
The setup suggests a potential uptrend with higher highs, but a breakdown below support may invalidate this move.
DYRO, NFA

BTCUSDT/IBIT: No Recovery in Sight Yet. Don't Be Fooled.Hello everyone. As I closely examine BTCUSDT and IBIT, I have a significant observation: there are no clear signals yet that selling is slowing down. This means it's too early to speak of a recovery in the market.
As intelligent investors, we look not only at price movements but also at the market's underlying dynamics. Currently, I see no clear indication in either BTCUSDT or IBIT that selling pressure is diminishing.
In such situations, a meticulous examination of the volume footprint is essential. We analyze every detail in the volume to understand if buyers are truly stepping in, and if selling orders are being absorbed. At the same time, I am closely monitoring CDV (Cumulative Delta Volume) divergences. If selling pressure were truly decreasing, we would expect to see clues in the CDV, but as of now, such confirmation is absent.
To confidently state that the market has entered a recovery phase, we need strong and confirmed breakouts on a low timeframe (LTF). Following these breakouts, a successful retest of the broken levels as support would be a reliable signal that the market has shifted direction. However, at present, such a structure has not formed.
As you know, I only trade coins that show a sudden and significant increase in volume. This approach allows me to focus my capital where the market is truly revealing its intentions. My current observation in BTCUSDT and IBIT is that this type of volume increase is not yet signaling a recovery.
Therefore, for those anticipating a market recovery, it is crucial not to act hastily and to await concrete confirmation signals. The market rewards the patient.
📌I keep my charts clean and simple because I believe clarity leads to better decisions.
📌My approach is built on years of experience and a solid track record. I don’t claim to know it all but I’m confident in my ability to spot high-probability setups.
📌If you would like to learn how to use the heatmap, cumulative volume delta and volume footprint techniques that I use below to determine very accurate demand regions, you can send me a private message. I help anyone who wants it completely free of charge.
🔑I have a long list of my proven technique below:
🎯 ZENUSDT.P: Patience & Profitability | %230 Reaction from the Sniper Entry
🐶 DOGEUSDT.P: Next Move
🎨 RENDERUSDT.P: Opportunity of the Month
💎 ETHUSDT.P: Where to Retrace
🟢 BNBUSDT.P: Potential Surge
📊 BTC Dominance: Reaction Zone
🌊 WAVESUSDT.P: Demand Zone Potential
🟣 UNIUSDT.P: Long-Term Trade
🔵 XRPUSDT.P: Entry Zones
🔗 LINKUSDT.P: Follow The River
📈 BTCUSDT.P: Two Key Demand Zones
🟩 POLUSDT: Bullish Momentum
🌟 PENDLEUSDT.P: Where Opportunity Meets Precision
🔥 BTCUSDT.P: Liquidation of Highly Leveraged Longs
🌊 SOLUSDT.P: SOL's Dip - Your Opportunity
🐸 1000PEPEUSDT.P: Prime Bounce Zone Unlocked
🚀 ETHUSDT.P: Set to Explode - Don't Miss This Game Changer
🤖 IQUSDT: Smart Plan
⚡️ PONDUSDT: A Trade Not Taken Is Better Than a Losing One
💼 STMXUSDT: 2 Buying Areas
🐢 TURBOUSDT: Buy Zones and Buyer Presence
🌍 ICPUSDT.P: Massive Upside Potential | Check the Trade Update For Seeing Results
🟠 IDEXUSDT: Spot Buy Area | %26 Profit if You Trade with MSB
📌 USUALUSDT: Buyers Are Active + %70 Profit in Total
🌟 FORTHUSDT: Sniper Entry +%26 Reaction
🐳 QKCUSDT: Sniper Entry +%57 Reaction
📊 BTC.D: Retest of Key Area Highly Likely
📊 XNOUSDT %80 Reaction with a Simple Blue Box!
📊 BELUSDT Amazing %120 Reaction!
📊 Simple Red Box, Extraordinary Results
📊 TIAUSDT | Still No Buyers—Maintaining a Bearish Outlook
📊 OGNUSDT | One of Today’s Highest Volume Gainers – +32.44%
I stopped adding to the list because it's kinda tiring to add 5-10 charts in every move but you can check my profile and see that it goes on..

BTC UPDATERegarding the Reaction to 104.000 level it is still possible to get one more mmove down to 103.000 level before the next Rally Up Towards 117.000 / 123.000 and further
Golden Cross? No Thanks!! Here’s How to Get In Early.📉 “Golden Cross? No Thanks. Here’s How to Get In Early.”
By FXProfessor
Everyone’s hyped about the Golden Cross again...
📰 “Bullish Signal!”
📈 “50 SMA crossed the 200!”
🎉 “Party time!”
Let me stop you right there.
If you’re waiting for that cross to go long —
You’re not late.
You’re definitely late.
The Golden Cross is a lagging indication.
It’s the afterparty. The smart money already had the drinks and left.
🔍 Here's the deal:
✅ Golden Cross forms after the move
✅ Price is usually already up double digits
✅ Sometimes it triggers right before a top
✅ Even EMAs (which I prefer) are still confirmation tools
✅ The real edge? Structure. Trendlines. Pressure zones.
📊 What I use instead:
-Custom EMAs that react faster
-My signature parallelogram method for early pressure
-Focus on trendlines and structure
-Above all — logic, not hype
- Fundamentals first!
For example, while the Golden Cross just printed, I was already watching $74,394 and $79,000.
Why? Because pressure builds before indicators react.
That's where the best entries live.
So next time someone posts
“Golden Cross confirmed!” 😏 Just smile and remember:
By the time the cross lights up, I’m already halfway to the next target.
Use EMAs if you like. But structure comes first.
That’s where the party starts.
One Love,
The FXProfessor 🧠📈
Disclosure: I am happy to be part of the Trade Nation's Influencer program and receive a monthly fee for using their TradingView charts in my analysis. Awesome people who care about the TRADER FIRST!

BTC 4H – Critical Support Zones Being TestedCRYPTOCAP:BTC is currently retesting its $107.2k support, which has now turned into resistance after a decisive breakdown.
Support Levels to Watch:
- Upper Support Zone: $105k – $104.4k
- Lower Support Zone: $101.4k – $100.7k
Bounce from $104.4k–$105k will be a temporary relief, but it needs strength to reclaim $107.2k.
If the upper zone is not held, the next leg will be towards the lower zone, near $101.4k—$100.7k.
Breakout confirmation only above $110k (previous rejection zone).
The market is showing signs of weakness, especially with increased selling around resistance. Avoid rushing into trades—better setups may come if key zones hold or break.
Tip: Watch for bullish divergences or strong volume at the lower support for potential reversal setups.

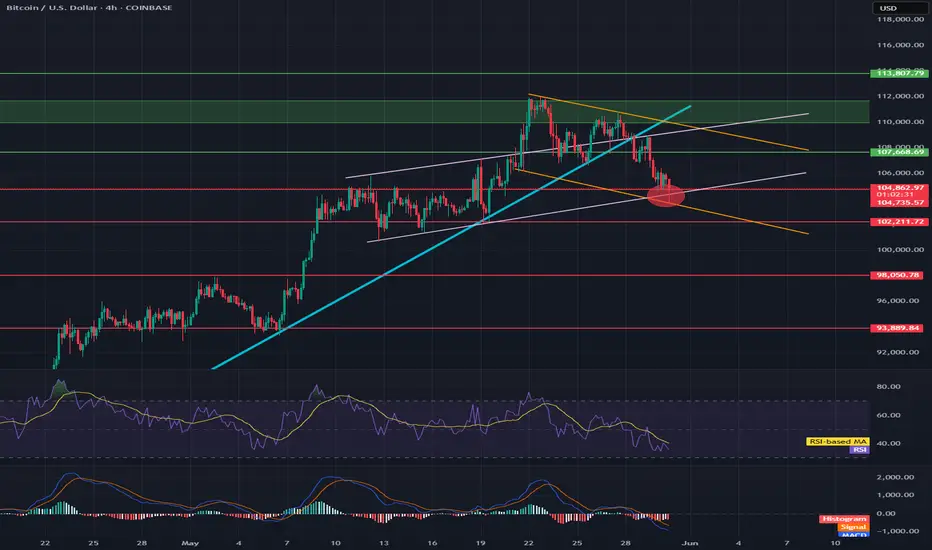
Will BTC hold its price?Hello everyone, I invite you to review the current situation on BTC. When we enter the four-hour interval, we can see how the BTC price has left the ongoing upward trend line at the bottom, and what's more, we can see how the current movement is creating a local downward trend channel in which the price is currently on the border of the previously created upward trend channel, which gives a strong support point.
Here we can see how the current downward movement has entered the support circle that starts around $ 104,800 and ends around $ 102,200, this is the place where two conflicting channels have converged. If these supports do not hold the price, we can see a quick recovery to around $ 98,000, and then to the level of $ 93,900.
Looking the other way, we can see that when the trend reverses, we first have resistance at $107,670, then a resistance zone from $110,000 to $111,700 is visible, at the border of two channels, and then resistance is visible around $113,800.
On the MACD indicator, we can see a return to the downtrend, while on the RSI we return to the lower part at the lower border, which could potentially provide energy for a future upward movement.
BTCUSD: Neutral on 1D means buy opportunity during rallies.Bitcoin has turned neutral on its 1D technical outlook (RSI = 51.351, MACD = 2908.600, ADX = 27.535) which is far from alarming as during Bull Cycle rallies such pullbacks are buy opportunities. Especially now that the price is even supported by the 1D MA50, which having cross above the 1D MA200 last week, they formed a Golden Cross. The pattern is identical to the last 1D Golden Cross, steady rally phases supported by HL trendlines that rose by roughly the same percentage. Their 1D RSI sequences also display similar formations. For that reason, we remain bullish on Bitcoin despite the current correction, targeting short term 119,000.
## If you like our free content follow our profile to get more daily ideas. ##
## Comments and likes are greatly appreciated. ##

BTCUSD INTRADAY supported at 103,330Trend Overview:
Bitcoin (BTC/USD) remains in a bullish trend, characterized by higher highs and higher lows. The recent intraday price action is forming a continuation consolidation pattern, suggesting a potential pause before a renewed move higher.
Key Technical Levels:
Support: 103,330 (primary pivot), followed by 100,680 and 97,700
Resistance: 113,040 (initial), then 115,510 and 117,510
Technical Outlook:
A pullback to the 103,330 level, which aligns with the previous consolidation zone, could act as a platform for renewed buying interest. A confirmed bounce from this support may trigger a continuation toward the next resistance levels at 113,040, 115,510, and ultimately 117,510.
Conversely, a daily close below 103,330 would suggest weakening bullish momentum. This scenario would shift the bias to bearish in the short term, potentially targeting 100,680 and 97,700 as downside levels.
Conclusion:
BTC/USD maintains a bullish structure while trading above the 103,330 support. A bounce from this level would validate the consolidation as a continuation pattern, with upside potential toward the 113,040 area. A breakdown below 103,330, however, would invalidate this view and suggest deeper corrective risk.
This communication is for informational purposes only and should not be viewed as any form of recommendation as to a particular course of action or as investment advice. It is not intended as an offer or solicitation for the purchase or sale of any financial instrument or as an official confirmation of any transaction. Opinions, estimates and assumptions expressed herein are made as of the date of this communication and are subject to change without notice. This communication has been prepared based upon information, including market prices, data and other information, believed to be reliable; however, Trade Nation does not warrant its completeness or accuracy. All market prices and market data contained in or attached to this communication are indicative and subject to change without notice.

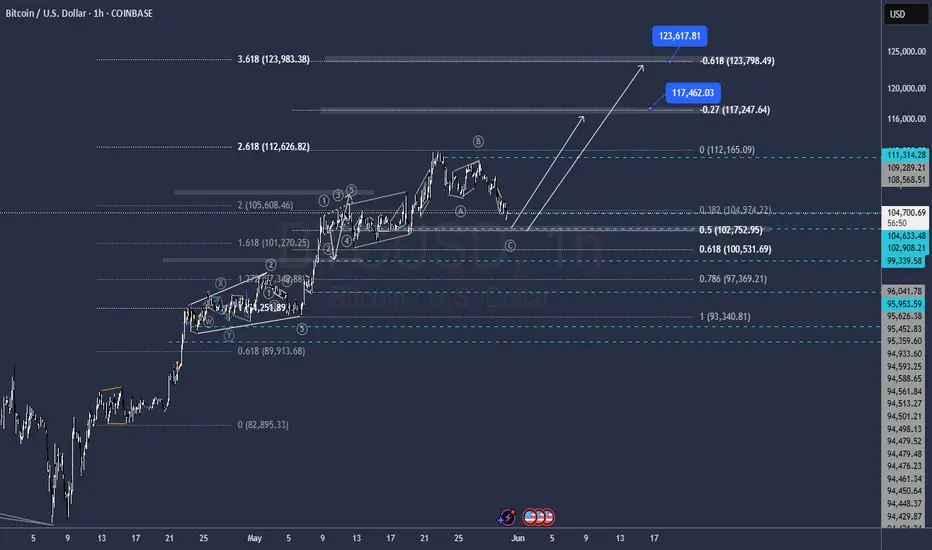
Bitcoin Is Entering Into Very Difficult TimesHello, Skyrexians!
I have been thinking what will happen next with BINANCE:BTCUSDT and it was obvious that correction has been started, you can easily find my recent update on Bitcoin and check it, but what will happen after. Today I decided that the first impulse has not been finessed yet and we need one more small leg up to complete this growth before significant correction.
Let's take a look at the yellow Elliott waves cycle. Awesome Oscillator gave me an idea that only wave 3 has been finished above $110k. Now price is printing wave 4. Wave 4 has a target between 0.38 and 0.5 Fibonacci, but this time it will be definitely 0.38 at $101k. Here was the smaller degree wave's 4 bottom. Wave 5 will be shortened because wave 3 was extended, it's very logically. After $111k retest the major wave 2 will go to $90k approximately. Difficult times ahead for crypto, I think this period will be finished only at the end of June.
Best regards,
Ivan Skyrexio
___________________________________________________________
Please, boost this article and subscribe our page if you like analysis!

SPY/QQQ Plan Your Trade for 5-30 : CRUSH PatternToday's CRUSH pattern should result in a continued downward price trend in my analysis is accurate. I have seen CRUSH pattern trend upward sometimes. So, please understand I'm reading the chart and pattern as a rolling top type of pattern leading to a CRUSH (downward) price trend today.
I highlight the potential for a FAILED CRUSH (downward) price bar - whereas a reversion back to the upside is a potential. But, I estimate that potential at only 20-25% at this time.
My analysis suggests the breakdown in price will likely continue, and we'll likely see the SPY/QQQ/Bitcoin continue to try to trend downward.
Gold and Silver are moving into a fairly solid Gap-Stall-Revert-Flush pattern that may see Gold attempt to rally back above $3400 today. Silver is currently trading very close to a STDDEV Reversion level, so Silver may not see a big move today (like Gold).
I'm hopeful we start to see a big breakaway move in Gold/Silver today and carry into next week.
My TTScanner algos generated new BUY triggers for GDX, GDXJ, and NUGT yesterday. That's a very good sign we are getting into a BUY/BULLISH mode in metals again.
I got up late today. Somehow, my alarms got turned off.
Happy Friday.
Get some.
#trading #research #investing #tradingalgos #tradingsignals #cycles #fibonacci #elliotwave #modelingsystems #stocks #bitcoin #btcusd #cryptos #spy #gold #nq #investing #trading #spytrading #spymarket #tradingmarket #stockmarket #silver

BTC-USD triangle rejection. Target 101k USDThere is clear triangle formed, and now we have rejection of the price. Drop target is 101k USD. Let's see what future will bring.

TRBUSDT Forming classical Bullish BreakoutTRBUSDT has recently broken out of a long accumulation zone, forming a classic bullish breakout structure on the daily chart. The asset saw a significant surge from the key support zone between $28 to $32, which has now been confirmed as a strong demand area. The breakout was backed by a sharp spike in volume, indicating strong buyer conviction and institutional interest entering the market. This breakout marks a pivotal shift in momentum and suggests that the bulls are in full control.
The technical setup points to a potential rally of 100% to 130%, targeting levels around the $75 mark and beyond. The previous resistance zones have been decisively cleared, and the strong green candles hint at the possibility of a sustained uptrend. If the asset holds above the breakout level and continues to consolidate at higher levels, it could build a strong base for the next impulsive move. This kind of vertical price action is often seen in assets with growing investor demand and limited supply pressure.
Investor interest in TRB is noticeably rising, as reflected in the increased social media chatter, positive sentiment across crypto forums, and higher engagement on trading platforms. The coin is benefiting from renewed market confidence and strong fundamentals. With macro tailwinds in the crypto market and a technically sound chart, TRB appears poised to outperform in the coming weeks.
Traders should closely monitor the price action around $50–$52 for potential retest opportunities. A successful retest followed by bullish continuation could offer a high-risk/reward long setup. The projected upside remains highly favorable, supported by robust volume and clean technical structure.
✅ Show your support by hitting the like button and
✅ Leaving a comment below! (What is You opinion about this Coin)
Your feedback and engagement keep me inspired to share more insightful market analysis with you!
