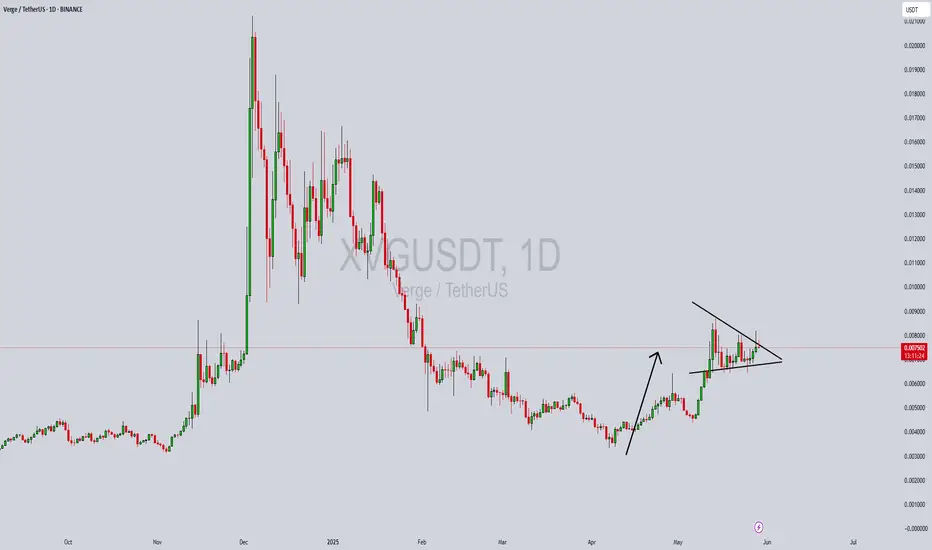
XVGUSDT Forming Bullish PennantXVGUSDT is currently showcasing a bullish pennant formation—a continuation pattern that typically signals the resumption of a strong uptrend. This pattern forms after a sharp upward move, followed by a period of consolidation, which is now evident in XVG’s price action. With the pennant nearing its breakout point and volume starting to pick up, the probability of an upward breakout is increasing significantly.
This setup often draws the attention of traders and investors, especially when paired with rising volume and solid project fundamentals. The consolidation within the pennant suggests accumulation, while the narrowing structure indicates that a volatility expansion may be imminent. If price breaks above the pennant resistance with confirmation from volume, XVG could realistically achieve a 40% to 50% move in the short to medium term.
Market sentiment around XVG is improving, as it's regaining attention due to increasing on-chain activity and renewed interest from long-term holders. The bullish pennant, when forming in a broader market recovery or bullish environment, can act as a strong springboard for price. Traders looking for technical breakouts are already watching this pair for a potential entry setup.
With investor confidence growing and XVG forming a powerful bullish pattern, this crypto pair holds strong upside potential. Keep a close eye on the breakout level, as a decisive move above it could mark the beginning of a significant rally.
✅ Show your support by hitting the like button and
✅ Leaving a comment below! (What is You opinion about this Coin)
Your feedback and engagement keep me inspired to share more insightful market analysis with you!
1-BTCUSD
TONUSDT Forming Falling Wedge TONUSDT is currently forming a classic falling wedge pattern—a historically bullish setup that often precedes major price breakouts. The recent breakout from the wedge accompanied by a significant surge in volume indicates a shift in market sentiment. This pattern suggests the end of a downtrend and the beginning of a new bullish wave. Such formations often result in strong upward price action once the resistance trendline is broken with volume confirmation.
Market participants have shown renewed interest in TON, with price currently stabilizing above a previous key resistance level, now potentially acting as support. This shift aligns with the historical behavior of wedge breakouts, where the asset consolidates briefly before continuing its climb. The current structure and momentum signal a potential 90% to 100% price appreciation, especially as investors recognize the strength of the breakout and the fundamental developments behind the project.
The volume profile further supports this bullish thesis. An increase in buying pressure at the breakout level reinforces the conviction that a trend reversal is in play. If TON maintains its bullish structure, the next major resistance zones could be tested, offering traders and long-term holders a strong opportunity to capitalize on this technical shift.
With rising investor interest and a textbook bullish pattern breakout, TONUSDT is a crypto pair to watch closely. The breakout from the falling wedge combined with solid volume growth and increasing sentiment across crypto communities signals that a new uptrend could be underway.
✅ Show your support by hitting the like button and
✅ Leaving a comment below! (What is You opinion about this Coin)
Your feedback and engagement keep me inspired to share more insightful market analysis with you!

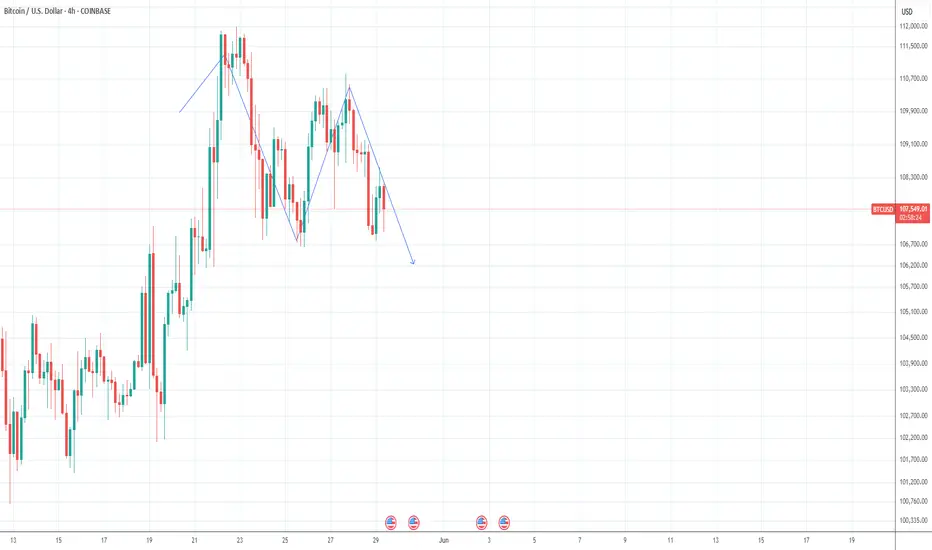
BTC shell fall!!!?This is how i am looking at market...
I can see a bearish triangle pattern in 4hr chart, which shows that btc may go 109,000-109,800 to complete third spike, then it might fall, main Support level will be 107,000-106,890, if market breaks it successfully then BTC may show 102,000 or if btc respect it's support level, then market may touch all time high 114,000!!!.

BTCUSDT LONG - TRADING PLANBTC Making a ABCD Pattern and follow the Trend Line it mate break the trend line but we have to focus on High High and High Low. My Entry is on pervious HH and my TP is D Point. I hope you Get this Trade. Thank you

Bitcoin + $200k is magneI disagree with the claim that bitcoin local peak was seen highlighted in ct. I think the bitcoin run will continue and the local peak will be around +$200k
If we take the stretched cycles as a basis, we can understand this through many indicators.

BITCOIN Desperately needs that weekly closing!Bitcoin (BTCUSD) broke last week above its January Resistance, effectively making a new All Time High (ATH). Technically, within BTC's dominant 2.5-year Channel Up, that is not enough to generate a bullish extension on its own and the reason is that a 1W candle closing above the Resistance level is needed and not just a break.
At least that's what happened during the last two Bullish Legs, where it required a convincing 1W candle close considerably above the Resistance, to confirm the Bullish Extension. In fact the break-out candles on both previous Bullish Legs is fairly identical.
The minimum % rise on the pattern's three Bullish Legs has been +96.75% with the others not falling way off that range (+98.74% and +106.94%). As a result, the bare minimum Target we can be expecting, in the event of a 1W candle closing above the $109500 Resistance, is $147000.
Do you think that' within the market's immediate reach? Feel free to let us know in the comments section below!
-------------------------------------------------------------------------------
** Please LIKE 👍, FOLLOW ✅, SHARE 🙌 and COMMENT ✍ if you enjoy this idea! Also share your ideas and charts in the comments section below! This is best way to keep it relevant, support us, keep the content here free and allow the idea to reach as many people as possible. **
-------------------------------------------------------------------------------
💸💸💸💸💸💸
👇 👇 👇 👇 👇 👇

UNIUSDT Forming Bullish Wave UNIUSDT is exhibiting a compelling bullish wave formation, rebounding robustly from a well-established support level. This resurgence is underpinned by a notable increase in trading volume, signaling heightened investor interest and potential for significant upward movement. The current market dynamics suggest a favorable environment for UNI, with technical indicators aligning to support a bullish outlook.
Trading Lounge
+7
The Currency Analytics
+7
Reddit
+7
The recent price action has seen UNI reclaim key support zones, demonstrating resilience and the capacity for sustained growth. Technical analyses indicate that if UNI maintains its trajectory, it could achieve gains in the range of 150% to 160%, targeting resistance levels that have previously acted as significant price ceilings. The convergence of increased volume and positive price movement often precedes substantial rallies, and UNI appears poised to capitalize on this momentum.
Investors are increasingly attentive to UNI's performance, recognizing the potential for substantial returns. The current setup offers an attractive risk-reward ratio, particularly for traders seeking to leverage the anticipated bullish wave. As UNI continues to garner attention, its market position strengthens, further validating the optimistic projections surrounding its price movement.
In summary, UNIUSDT's technical indicators and market sentiment coalesce to present a promising opportunity for traders and investors alike. The alignment of a bullish wave pattern, reinforced by strong support and escalating volume, underscores the potential for significant price appreciation in the near term.
✅ Show your support by hitting the like button and
✅ Leaving a comment below! (What is You opinion about this Coin)
Your feedback and engagement keep me inspired to share more insightful market analysis with you!

Bearish drop?The Bitcoin (BTC/USD) has reacted off the pivot, which lines up with the 38.2% Fibonacci retracement, and could drop to the 1st support, which lines up with the 127.2% Fibonacci extension.
Pivot: 108,411.31
1st Support: 105,349.38
1st Resistance: 109,146.02
Risk Warning:
Trading Forex and CFDs carries a high level of risk to your capital and you should only trade with money you can afford to lose. Trading Forex and CFDs may not be suitable for all investors, so please ensure that you fully understand the risks involved and seek independent advice if necessary.
Disclaimer:
The above opinions given constitute general market commentary, and do not constitute the opinion or advice of IC Markets or any form of personal or investment advice.
Any opinions, news, research, analyses, prices, other information, or links to third-party sites contained on this website are provided on an "as-is" basis, are intended only to be informative, is not an advice nor a recommendation, nor research, or a record of our trading prices, or an offer of, or solicitation for a transaction in any financial instrument and thus should not be treated as such. The information provided does not involve any specific investment objectives, financial situation and needs of any specific person who may receive it. Please be aware, that past performance is not a reliable indicator of future performance and/or results. Past Performance or Forward-looking scenarios based upon the reasonable beliefs of the third-party provider are not a guarantee of future performance. Actual results may differ materially from those anticipated in forward-looking or past performance statements. IC Markets makes no representation or warranty and assumes no liability as to the accuracy or completeness of the information provided, nor any loss arising from any investment based on a recommendation, forecast or any information supplied by any third-party.

my prediction is on bitcoin downward correction is onprevious post i told you guys bitcon need a downward correction. now see the results already its' going down.
BTC/USDT 1DAY CHART UPDATE !!BTC/USDT Chart Analysis
The price has broken above a key resistance area (~$104,000–$105,000) and is now retesting it as support.
The 50-day (red) and 200-day (green) moving averages slope upward, indicating bullish momentum.
Price activity consolidates just above the key resistance-to-support area, indicating accumulation ahead of a potential breakout.
If the price sustains above $104,000, we could see continuation towards $120,000–$125,000.
A break below $104,000 could see the price retest lower support areas near $100,000 or even $97,000–$98,000.
Conclusion:
Bullish bias above $104,000.
If support fails, a bearish move is possible, but momentum is in the bulls’ favor right now.
Stay tuned for updates and key levels to watch!
Thanks for your support!
DYOR. NFA

BTC CMA 92,000BTC CMA 92,000
We are currently at a temporary peak and strong, but not final, selling zone. We have a price gap reaching 92k, and a strong reversal to it is expected. Stay tuned for any new updates.

Next Volatility Period: Around June 6
Hello, traders.
Please "Follow" to get the latest information quickly.
Have a nice day today.
-------------------------------------
(BTCUSDT 1D chart)
This is the last day of this volatility period.
To continue the uptrend, the price needs to rise above at least 109403.63 and hold.
If it fails to rise, we need to check if it is supported near 106843.58.
And we need to see if it can touch the M-Signal indicator on the 1D chart and rise.
If the price is maintained above the HA-High indicator, it is also important to see if the price can be maintained above 106843.58, as there is a possibility of a stepwise rise.
The next volatility period is expected to be around June 6.
-
(30m chart)
It seems that the basic trading strategy is being followed faithfully.
That is, it is showing a pattern of buying near the HA-Low indicator and selling near the HA-High indicator.
Therefore, we need to focus on finding a trading point when the HA-Low or HA-High indicator is touched.
However, if it is supported by the HA-High indicator and rises, it is likely to show a stepwise upward trend, and if it is resisted by the HA-Low indicator and falls, it is likely to show a stepwise downward trend.
Even so, we must not forget that the end of a stepwise upward trend is a decline, and the end of a stepwise downward trend is an increase.
At the current price position, the important points on the 1D chart are 111696.21, 109403.63, and 106843.58.
Therefore, when looking at the 30m chart, if the HA-Low and HA-High indicators are generated near the important points above, it is necessary to interpret that point as forming a more important section.
In other words, the HA-Low indicator was generated at the 107096.41 point near the current 106843.58 point, and it eventually showed an upward trend.
Therefore, if the HA-Low indicator is newly generated as the price falls, you should check if there is an important point near it.
Otherwise, if it touches the existing HA-Low indicator point of 107094.41 again, it is more likely to fall because it touches the second time, so you need to be careful when trading.
This means that the HA-Low indicator is likely to rise when it is first generated, and is likely to fall when it touches the second time.
Conversely, the HA-High indicator is likely to fall when it is first generated, and is likely to rise when it touches the second time.
Since the interpretation of the indicator is not 100% applicable, you should check the support and find the trading point.
-
Thank you for reading to the end.
I hope you have a successful trade.
--------------------------------------------------
- This is an explanation of the big picture.
(3-year bull market, 1-year bear market pattern)
I will explain more details when the bear market starts.
------------------------------------------------------

GameStop goes crypto: what 4,710 BTC means for the chartGameStop has disclosed a $500 million investment in Bitcoin, marking its first significant move into the crypto space.
The video game retailer is sitting on $4.76 billion in cash and hasn’t disclosed a limit on future purchases.
GameStop shares fell 10% following the announcement, while Bitcoin pulled back toward $107,000. A 14% rally would be needed for BTC to reach the 127.2% Fibonacci extension at $122,000, while $103,800 could be a key support level where we previously saw consolidation.
CEO Ryan Cohen addressed the Bitcoin 2025 Conference in Las Vegas via pre-recorded video Wednesday too, citing macroeconomic concerns as a key driver behind the company’s decision. These likely include rising U.S. debt levels and trump tariffs.

BTCUSD: 1M turned overbought and that's not alarming at all! Bitcoin has turned bullish even on its 1M technical outlook (RSI = 70.030, MACD = 16,156.720, ADX = 38.100) but that's not a reason to expect any strong corrections as this is the part were it technically rises more during Bull Cycles. The basic structure of the Cycle is an Ascending Triangle which breaks when the parabolic rallies begin. Based on the ratio of the last two Cycles, the new rally should be around +130% from the top of the Ascending Triandle. That gives a $160,000 fair estimate as far as the Cycle top is concerned.
## If you like our free content follow our profile to get more daily ideas. ##
## Comments and likes are greatly appreciated. ##

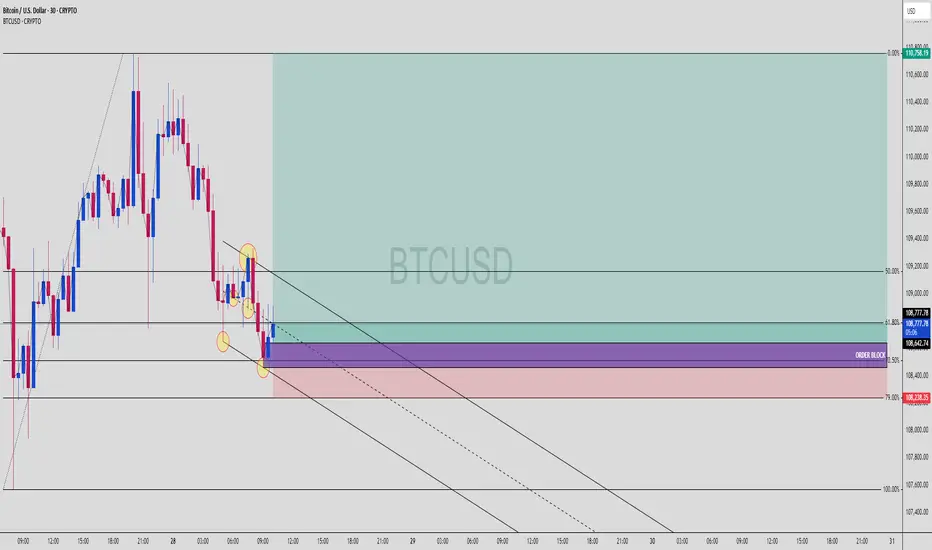
BTC Bulls Awakening from the Shadows – OB + 79% Fib Reaction 📈 BTCUSD | 30-Min Bullish Reversal Setup from OB + 79% Fib Zone
Smart Money never misses a good discount… and this BTCUSD setup is that juicy premium-to-discount play we wait for.
🔍 1. Price Action Context
Market sold off into a clearly defined Order Block
Price tapped precisely at the 79% Fib level
Internal liquidity sweep confirmed below recent equal lows
No candle close below OB = structure still intact
This is what we call the "Trap + Reverse" move. Late shorts just got baited.
🧱 2. Confluences Stacking Up
💎 79% Fib Retracement — Deep discount zone for Smart Money
💎 Bullish Order Block — Last up candle before the sharp sell-off
💎 Liquidity Sweep — Price swept short-term lows = inducement
💎 Channel Structure — Midline bounce = potential breakout
The OB + Fib overlap = a high-probability buy zone with minimal risk
🎯 3. Trade Plan
Entry Zone: 108,250–108,650
Stop Loss: Below 108,000
Take Profit: 110,758 (premium zone)
⚖️ 4. RRR (Risk-Reward Ratio)
📥 Entry: ~108,400
🔒 SL: 108,000
💰 TP: 110,758
✅ RRR ≈ 1:5.8
This is sniper-level asymmetric risk. You don’t chase candles — you wait here, like a lion in the grass 🦁.
🔁 5. What to Watch Next
Price must reclaim and close above 108,867 for confirmation
If we get a BOS (Break of Structure) above 109,200 = 🚀
Hold above the mid-channel line = bullish continuation
💬 Comment “LONGED BTC 💎” if you caught this with the OB bounce!
📌 Save this to study OB + Fib synergy.
👀 Watch price action at 109,200 — breakout zone incoming?
SPY/QQQ Plan Your Trade Update For 5-28 : Calm Before The StormThis update is designed to help you understand why the SPY/QQQ/BCTUSD, as well as GOLD/SILVER and others, should stay rather FLAT today.
Unless there is some major news event (or other event) before the NVDA earnings data, I suspect the markets will stay very muted/flat through the close of trading today.
I hope you are all enjoying my 'Plan Your Trade' videos. Now that I've gotten through most of the family doctor/medical issues, it's back to work for me.
I'm working on a BTCUSD Cycle Pattern system as well as more advanced algos/trade triggers for subscribers.
Let me know how I'm doing. Is there something you want to see in these videos? Let me know.
Get some.
#trading #research #investing #tradingalgos #tradingsignals #cycles #fibonacci #elliotwave #modelingsystems #stocks #bitcoin #btcusd #cryptos #spy #gold #nq #investing #trading #spytrading #spymarket #tradingmarket #stockmarket #silver


Fireworks after the summerBitcoin to climax in Aug/Sep 2025.
The charts are a little skewed because of depreciating dollar. There is no new ATH on the BTCEUR and BTCGBP charts. Don't get fooled by this range-bound move.
Let's try this.

BTC short term bearishness As I have mentioned in the previous post that BTC should correct a bit for another leg up towards a new ATH.
Anyone who took the trade should be in profit. There might be a big fat pump on 30th May.

Bitcoin - Bulls in Control $113k Next targetBitcoin just delivered a textbook bullish reaction following a decisive liquidity sweep beneath the 4H range lows. Instead of continuing lower or entering a consolidation phase, price responded with immediate strength, snapping back with velocity, reclaiming structural levels, and rejecting decisively from a key Fair Value Gap (FVG). This kind of aggressive post-sweep price action usually signals the end of a stop hunt and the beginning of a new directional leg, which, given the current structure, is leaning heavily to the upside.
This is not just a random bounce, it’s a clear shift in intent. The behavior we’re seeing reflects a strategic move by smart money: first clear out liquidity from trapped longs and eager breakout sellers, then reverse and defend key zones that align with institutional discount pricing. The result? A bullish narrative that looks ready to drive price significantly higher.
Liquidity Sweep and FVG Reclaim
The initial sharp drive lower ran through the 4H lows, which had built up significant liquidity from both early long entries and breakout traders looking for continuation. This kind of move is engineered, designed to clean the board before a major shift. Price wicked deep into a 4H Fair Value Gap and immediately snapped back above it, closing strong and leaving behind a long lower wick. That reaction tells a story: there was demand waiting, and it stepped in with authority.
The Fair Value Gap wasn't just tested, it was respected. The fact that price closed back above the gap, after wicking through it, confirms it wasn't simply a liquidity grab but also a moment of rebalancing. The imbalance created earlier was filled efficiently, and the market moved on. That combination of liquidity sweep, deep FVG test, and bullish close is often what marks the end of manipulation and the beginning of a true move. It's a clear signal of smart money stepping in and defending value.
Structural Shift and Accumulation Signal
Following the sweep, the structure shifted rapidly. Price reclaimed the previous 4H support base that had been broken during the stop hunt, invalidating the bearish continuation thesis and instead suggesting accumulation. This is classic behavior after a manipulation low, price doesn’t hesitate or consolidate much, it simply turns with strength.
We’re also seeing signs of absorption and accumulation, particularly in the way price rejected cleanly from discount levels and stabilized within the FVG range. Multiple attempts to break down have failed, and the bounce wasn’t just reactive, it came with commitment. With each retest of the 110.3K resistance, that level weakens structurally. What began as resistance is now showing signs of turning into a launchpad.
If this is indeed the final leg of an accumulation phase, we should expect a marked expansion soon. The setup aligns with smart money accumulation logic: sweep liquidity, shift structure, trap shorts, and then displace with force.
Price Targets and Expectations
The 110.3K level remains the most immediate point of interest. It has acted as resistance multiple times, but each rejection has grown weaker. If price clears this level with conviction, ideally through a sharp displacement candle, the breakout has legs. Above that, we enter clean air with little resistance overhead.
The next logical target becomes 113K, which aligns both psychologically and technically with the next liquidity cluster. It’s an untested zone and represents the next area where sellers might appear. However, given the strength of the reversal and lack of major supply between 110.3K and 113K, price could move swiftly once the breakout is confirmed.
Longer-term, if momentum holds and Bitcoin maintains strength above 110.3K, we could see a retest of the all-time highs come into focus sooner than expected. But for now, the priority is to monitor how price interacts with 110.3K and look for signs of breakout strength or failed move traps.
Conclusion
Bitcoin isn’t in a boring range or slow grind, it just executed a classic liquidity play: sweep, react, reclaim. The reaction off the 1H Fair Value Gap that followed the 4H sweep is a strong signal that the market has shifted gears. With clear signs of demand stepping in and structure now favoring the bulls, the 110.3K level looks increasingly vulnerable. If that breaks, the path toward higher prices, including 113K and beyond, opens up fast.
The overall context has shifted from consolidation to directional expansion, and everything about the recent move points toward the bulls regaining control. Keep your eyes on the structure, the volume, and the displacement above key levels, the next leg could be explosive.
___________________________________
Thanks for your support!
If you found this idea helpful or learned something new, drop a like 👍 and leave a comment, I’d love to hear your thoughts! 🚀

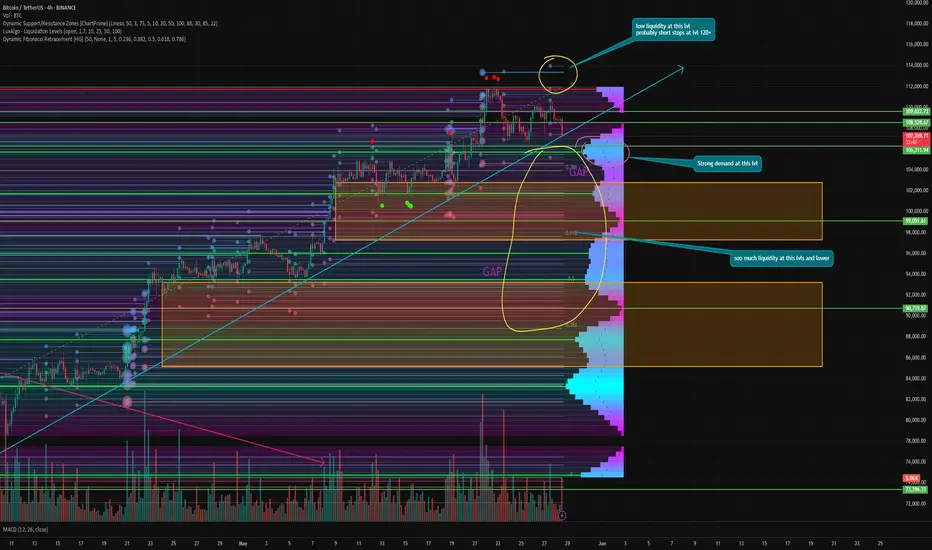
Is the momentum in Bitcoin EXHAUSTED? Or not yet?In recent days, Bitcoin has been actively updating its ATH almost daily. Everyone is already predicting $150,000 by the end of the month.
🔥 But is everything really so rosy? Let's take a closer look!
During the powerful growth over the past month, two gaps have formed below us. The first is at $97,368–102,867. The second is at $85,158–93,232. And as we know, in 99% of cases, gaps close sooner or later.
📊 Technical:
Liquidity zones - as we know, the price moves from liquidity to liquidity, which pushes it in one direction or another. Right now, there is practically no liquidity above us; it is all concentrated below. Only a move to $99,000 can now liquidate more than a billion dollars in longs.
I think short sellers' stops are much higher, at $120,000 and above. There is no point in placing them here when there is still no confirmation of a trend reversal.
⚙️ Metrics and indicators:
Volume - as I say in every review - is not a new growth impulse. It is a technical rebound. It has been moving at reduced volumes all along, which have only continued to decline.
MACD - has already given a bearish crossover , but this is certainly not the best indicator on such a TF. However, in combination with other indicators, it can predict a trend reversal at the right time.
DSRZ - shows the volume of interest at certain levels, and now we see that the first block of interest is concentrated in the $106,000–104,000 zone. These are the first support levels, from which I will expect the first rebound if the correction continues.
Liquidation Levels - as I said, all liquidity is now concentrated at the bottom. Bitcoin is very overheated and it's time to cool it down. Many think that it will be overheated when, as in the previous cycle, funding will be 0.2 and above.
But this is a different cycle, a different time, different traders, and different rules. This has already been proven more than once in this cycle.
📌 Conclusion:
I have said many times that we should not expect much from this momentum and that it is purely a technical rebound. And if something does not push us sharply upward now to bring in retail, we can definitely not expect it before the fall.
Summer is coming, investors and traders will close their positions and go on vacation. The market will be quiet.
So, personally, I am leaning back in my chair, expecting a price of at least $85,000, and watching what happens next. 🥃
BTCUSD | Head and Shoulders Pattern on 15m Chart Suggesting PoteBitcoin (BTCUSD) on the 15-minute timeframe has formed a classic Head and Shoulders structure, a well-known pattern often associated with possible short-term trend reversals.
Key Details:
Pattern: Clear Left Shoulder, Head, and Right Shoulder formation.
Neckline Level: Around 107,437 – currently acting as a crucial support zone.
Trendline: Price has broken below a short-term rising trendline, confirming pattern completion.
Volume Analysis: Volume increased during the formation of the head, hinting at a potential shift in sentiment.
Note: A confirmed close below 107,400 may attract further downside movement. Conversely, holding above this level could lead to consolidation or recovery.
This analysis is intended for educational purposes—please evaluate risk and confirm with your own strategy before taking any trade decisions.

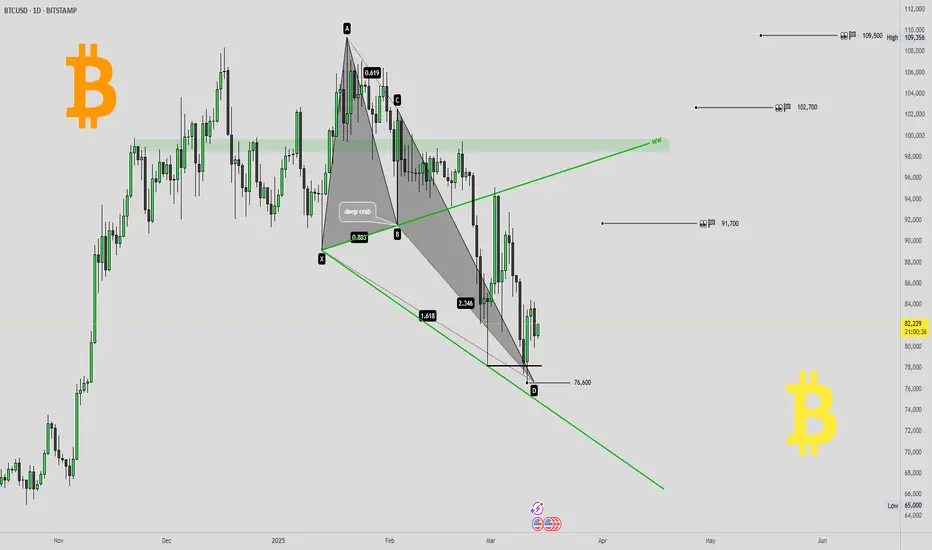
Bitcoin reversal confirmed ?!Bitcoin reversal confirmed ?! 👀
I would like to present you some charts with important levels and relevant patterns.
🖥daily-chart (BITSTAMP) and 💡everything important in the chart 👀
💥Here in the daily chart (BITSTAMP)
- a Deep-Crab harmonic with
- a WolveWave
and the daily-chart of the
🔥Daily MA200 re-test 👀
- gap fill
- support-line 2022 and 2024 TOPs
👉 BITCOIN roadmap/outlook (from 27th february 2024) 💡
🎯 If you like this idea, please leave me a 🚀 and follow for updates 🔥⏰
Furthermore, any criticism is welcome as well as any suggestions etc. - You're also very welcome to share this idea.
Have a nice evening & successful trading decisions 💪
M_a_d_d_e_n ✌
NOTE: The above information represents my idea and is not an investment/trading recommendation! Without any guarantee & exclusion of liability!