BTCUSD INTRADAY Bullish energy buildup supported at 107,650Trend Overview:
Bitcoin (BTC/USD) remains in a bullish trend, characterized by higher highs and higher lows. The recent intraday price action is forming a continuation consolidation pattern, suggesting a potential pause before a renewed move higher.
Key Technical Levels:
Support: 107,650 (primary pivot), followed by 103,330 and 100,680
Resistance: 113,040 (initial), then 115,510 and 117,510
Technical Outlook:
A pullback to the 107,650 level, which aligns with the previous consolidation zone, could act as a platform for renewed buying interest. A confirmed bounce from this support may trigger a continuation toward the next resistance levels at 113,040, 115,510, and ultimately 117,510.
Conversely, a daily close below 107,650 would suggest weakening bullish momentum. This scenario would shift the bias to bearish in the short term, potentially targeting 103,330 and 100,680 as downside levels.
Conclusion:
BTC/USD maintains a bullish structure while trading above the 107,650 support. A bounce from this level would validate the consolidation as a continuation pattern, with upside potential toward the 117,500 area. A breakdown below 107,650, however, would invalidate this view and suggest deeper corrective risk.
This communication is for informational purposes only and should not be viewed as any form of recommendation as to a particular course of action or as investment advice. It is not intended as an offer or solicitation for the purchase or sale of any financial instrument or as an official confirmation of any transaction. Opinions, estimates and assumptions expressed herein are made as of the date of this communication and are subject to change without notice. This communication has been prepared based upon information, including market prices, data and other information, believed to be reliable; however, Trade Nation does not warrant its completeness or accuracy. All market prices and market data contained in or attached to this communication are indicative and subject to change without notice.
1-BTCUSD

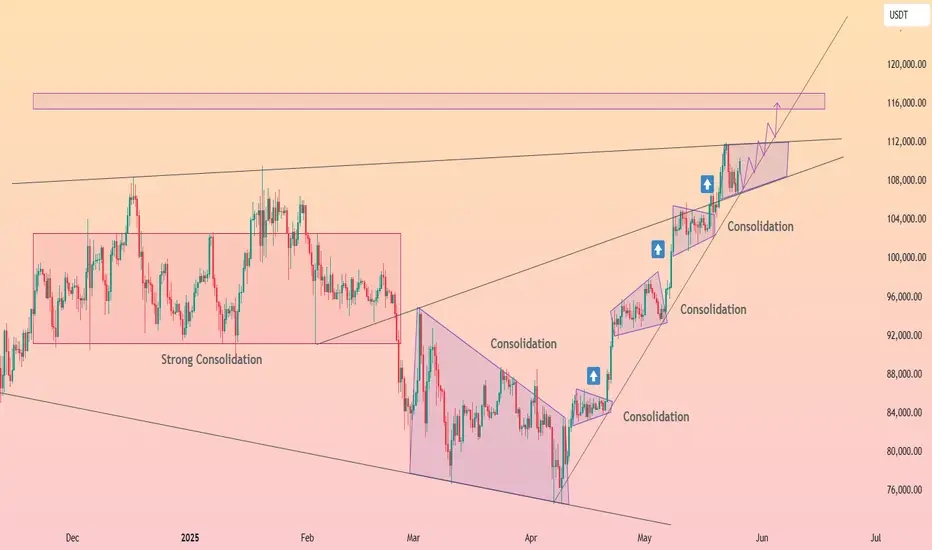
HolderStat┆BTCUSD stairway to New ATHCRYPTOCAP:BTC — Price action grinds up a steep ascending trendline, printing serial consolidation flags that keep bullish momentum intact. Holding 108-109 k support leaves room for a thrust toward the 115-118 k liquidity / new-ATH zone highlighted above. Breakout continuation, higher-highs narrative alive while the wedge floor protects the move.
SPY/QQQ Plan Your Trade For 5-27-25 : Blank PatternToday's SPY Cycle Pattern is BLANK. This suggests the market will trend similarly to what we've seen over the past few days - likely melting upward.
A BLANK pattern is a price structure I have not identified as some type of price structure yet. I will check the data to see if I can find anything that correlates with this pattern throughout today.
Generally, we are rolling into a consolidation phase that may attempt to break higher or continue consolidating and roll downward.
Overall, the alignment with the Fibonacci trigger levels suggests the markets will continue to struggle near the ranges I've shown on my charts.
Gold and Silver are rolling downward - likely as a result of the EU tariff pause. That move to pause EU tariffs takes quite a bit of pressure off the metals markets.
I do believe the Gold/Silver will continue to try to rocket higher - but this week metals may stay somewhat flat and trend downward a bit.
BTCUSD is setting up a MASSIVE Excess Phase Peak pattern. This is a very big price rotation that could either INVALIDATE (upward) or CONFIRM (downward). If we get confirmation, BTCUSD could fall back below $75k very easily. If we get invalidation, the sky is the limit to the upside.
Ultimately, I believe the global markets need another 60-90+ days to settle with all the global trade/tariff and other issues before moving into a more bullish price trend.
We'll see if I'm right or not over the next 60-90+ days.
Get some.
#trading #research #investing #tradingalgos #tradingsignals #cycles #fibonacci #elliotwave #modelingsystems #stocks #bitcoin #btcusd #cryptos #spy #gold #nq #investing #trading #spytrading #spymarket #tradingmarket #stockmarket #silver

trap ya “liquidity grab” jaisa zone ho sakta hai.Jahan sab buyers wave 5 ko continuation samajh ke buy karein,
Tumhara analysis keh raha hai ki wahan se reversal hoga.
Ye trap ya “liquidity grab” jaisa zone ho sakta hai.
Chart me price ne 5 wave ka bullish pattern complete kiya.
Ab wo Supply Zone me hai jahan se girne ke chances hain.
Tum expect kar rahe ho BOS ke saath downtrend shuru hoga.
Final target lower demand zones tak hai.

The season of altcoins and Bitcoin dominance may be coming to anMarkets are shifting, liquidity is low. Those who’ve been riding the wave may want to start thinking about rotation, profit-taking, and strategic positioning.
In crypto, timing isn’t everything - it’s the only thing🧠📉📈

BTCUSD Curve Breakout & MMC Structure | Targeting $111KIn this idea, we apply Mirror Market Concepts (MMC), a method of analyzing symmetrical price behavior to forecast key market moves. This BTC/USD 15-minute chart showcases a beautiful execution of MMC principles, blending curved structure analysis, SR interchange, and trendline dynamics to capture a compelling bullish opportunity.
🧩 Chart Structure Analysis (Detailed Breakdown):
🔸 1. Curve Line Formation & Mirror Market Concepts (MMC):
The centerpiece of this analysis is the curved market structure, which resembles a cup-like formation. Using MMC, the market is seen as reacting in mirrored patterns — left side = right side. In this context, the curve mimics the balance of supply and demand over time, providing a visual roadmap of potential price behavior.
Curve Line Resistance: The upper black arc served as dynamic resistance.
Curve Line Support: The lower arc acted as dynamic support.
Once price broke above the curved resistance, it confirmed a bullish market structure shift, triggering a key breakout signal.
🔸 2. Breakout & Retest Pattern:
Following the curve line resistance breakout, price pulled back for a retest, validating the structure. This is a high-probability continuation setup where:
The breakout confirms bullish interest.
The retest confirms that former resistance is now support.
This retest occurred exactly near the intersection of:
Curve Line Support
SR Interchange Zone (gray shaded area)
Trendline Support
This confluence adds strength to the bullish outlook.
🔸 3. SR Interchange Zone (Support/Resistance Flip):
The horizontal SR Interchange area is a key pivot zone, where price previously faced resistance. After the breakout, price came back to this level and found strong buying interest, flipping it into support.
This acts as a reaccumulation zone.
Price rejected from this zone with a clean bullish impulse.
🔸 4. Trendline Support Validation:
After the retest, price formed a new ascending trendline, respected multiple times by price. This ascending trendline acts as a guide for trailing stop placements or re-entry zones. Price remained above this trendline, reinforcing bullish structure integrity.
🔸 5. Central Zone & Liquidity Sweep:
The Central Zone marked a midpoint in the curve, which:
Acts as a balance point between the mirrored halves.
Is often used as a liquidity grab area before direction continuation.
Price dipped into this zone, likely collecting stop orders or liquidity before reversing higher — a classic MMC behavior.
🔸 6. 50% Retracement Level:
A horizontal marker near the 50% retracement level serves as a psychological and technical barrier. As of the last candle:
Price is hovering around this midpoint.
A breakout above this level would trigger further bullish movement toward the target zone.
Traders often look for volume expansion at this point to confirm conviction.
🔸 7. Target Zone (Projected via Curve Symmetry & Range Extension):
The target zone is marked near $111,600, based on:
Mirror projection of the curve's depth (height symmetry).
Range extension from the curve’s breakout.
Potential measured move based on pre- and post-breakout range.
This level represents a logical exit or partial TP zone for long positions.
📈 Trading Plan Summary:
Entry Zone: After breakout and retest around the SR Interchange/Curve Support/Trendline Confluence.
Support Confirmation: Trendline holding and bullish structure above central zone.
Mid-Target: 50% retracement breakout ($110,400).
Main Target: $111,600+ target zone based on curve projection.
Invalidation: Clear break below trendline and loss of SR flip zone.
🔍 Educational Takeaways:
Mirror Market Concepts (MMC) are highly effective in anticipating symmetrical price behavior.
Confluence of curved breakout, SR flip, and trendline validation provides high confidence in trade setups.
Market symmetry helps define logical targets, entries, and risk zones.
Always look for a pullback to structure — the best trades often come after the breakout and confirmation.
🚨 Risk Management Reminder:
As always, proper risk management is crucial. Wait for confirmation before entering, and use stop-losses below structural levels (such as the trendline or SR Interchange zone) to limit downside risk.

DeGRAM | BTCUSD held the $ 107k level📊 Technical Analysis
● After clearing the Feb-Apr supply (105.7 k-108 k), price has twice retested it as support, printing successive higher-low wicks and locking the purple trend-line as a launch pad.
● The advance is tracking the mid-line of a rising channel; the swing structure sketches a fresh ascending triangle whose projection aligns with the red 114–115 k ceiling at the channel roof.
💡 Fundamental Analysis
● BTC spot ETFs absorbed another ≈4 600 BTC this week while CME open-interest hit a 6-week high, signalling renewed institutional accumulation despite softer US data and a retreating DXY.
✨ Summary
Buy 106-109 k on pull-backs; triangle break above 111.5 k targets 114 k then 115 k. Bull view invalidated on a daily close beneath 105 k.
-------------------
Share your opinion in the comments and support the idea with a like. Thanks for your support!

BTCUSD Potential Reversal | Head and Shoulders Pattern FormedBitcoin (BTC/USD) is showing signs of a potential bearish reversal, forming a clear Head and Shoulders pattern on the 15-minute chart.
Key Technical Insights:
The structure is aligned with a classic head and shoulders setup.
Price action has respected the descending trendline resistance.
The right shoulder has formed under key supply pressure, increasing the probability of a drop.
A breakdown below the neckline could drive price toward the 107,400 zone.
Target zone aligns with previous consolidation and demand area.
This setup offers a well-defined risk-to-reward structure, based on pattern confirmation and market structure.
📉 Pattern-based idea with proper technical reasoning. Monitoring closely for breakdown and follow-through price action.

AudCad..PWL taken!!Good day traders, I’m back with another setup on AudCad and I like that previous week low was taken. We can now look at the power of 3 with higher TF in mind.
On the 4H TF price has been bearish but we can see that price left very “smooth” highs(relative equal highs) but ICT teaches us that price will always go back to make the smooth highs, smooth cries(liquidity sweep).
Before price took our low it left a FVG that’s we wanna see turn into an inverse.
The first target has to be our internal liquidity than the external liquidity that also has relatively equal highs too.

Bitcoin (BTC/USDT) – Flag Breakout Points to $114KHello guys!
Bitcoin continues to respect the bullish structure within its ascending channel, and we just got a clean breakout from a textbook bull flag.
After a solid move higher earlier this month, BTC cooled off inside a tight flag pattern, consolidating above $106K. That pullback helped reset momentum, and now we’ve broken out with conviction.
You can read about it here:
We’re currently hovering around $ 109.8 K. A short-term retest of the breakout zone near $108K–$108.5K wouldn’t be surprising. it could even offer a great entry opportunity before the next leg up.
If momentum holds, the projected target from this flag pattern lands in the $113.5K–$114K zone.
watch these:
Support: $107.5K–$108.5K
Target: $114K
Invalidation: Break below $107K
Bias remains bullish unless we lose the channel structure.

BITCOIN repeating every Cycle's final rally!Bitcoin (BTCUSD) has been on a strong rally since the April 2025 bottom on the 1W MA50 (blue trend-line) and that's perfectly aligned with the 1W MA50 rebound it had on the previous two Cycles in June 2021 and June 2017.
As you can see, those (blue circles) where the All Time High (ATH) Pivot trend-line test before the final (parabolic) rally of the Cycle started, which was its most aggressive part.
In 2017 it was much stronger and the price rallied much higher, which is natural as the market was much less mature (institutionally) than today, but it is not improbable to get a rally similar to July - November 2021.
Can that be enough to push BTC to $150k and beyond? Feel free to let us know in the comments section below!
-------------------------------------------------------------------------------
** Please LIKE 👍, FOLLOW ✅, SHARE 🙌 and COMMENT ✍ if you enjoy this idea! Also share your ideas and charts in the comments section below! This is best way to keep it relevant, support us, keep the content here free and allow the idea to reach as many people as possible. **
-------------------------------------------------------------------------------
💸💸💸💸💸💸
👇 👇 👇 👇 👇 👇

BTC Short Locked – FVG + 79% Fib = Liquidity Grab Incoming📉 BTCUSD | 1H Smart Money Short – Premium Rejection in Play
Bitcoin just tapped into a nasty supply zone that aligns with:
🟥 Fair Value Gap (FVG)
🔻 79% Fibonacci Retracement
💥 Previous Breaker Block Zone
🧠 Clean Internal Liquidity sweep
🚩 Structure still bearish – no HH
🔍 1. Market Structure Breakdown
Price broke down aggressively from the top (early signs of redistribution)
We’re now retesting the FVG + OB zone
No candle close above the Strong High = still valid bearish context
🧱 2. Zone Confluence
📍 FVG (Fair Value Gap): Imbalance created during impulsive sell-off
📍 OB + Breaker: Strong resistance holding inside 70.5%–79% retracement
📍 Strong High: Still protected
📍 Weak Low: Below = prime target for liquidity sweep
Price kissed the edge of that 79% Fib and immediately rejected = 🔥 confidence for a swing short
🎯 3. Trade Plan
Entry: Around 110,800 (inside FVG zone)
Stop Loss: Above 112,400 (Strong High)
Take Profit: 105,248 (below Weak Low liquidity)
⚖️ 4. RRR (Risk-Reward Ratio)
📥 Entry: 110,800
🔒 SL: 112,400
💰 TP: 105,248
✅ RRR ≈ 1:3.5
Solid asymmetric setup with clearly defined structure, inducement, and imbalance = Smart Money textbook trade.
📉 5. Why This Works
Retail longs are entering late = exit liquidity for big players
Price filled the FVG but failed to break structure
Weak low below is clean AF, likely to be swept for continuation
1H/4H alignment = high conviction short
💬 Type "SHORTED BTC 💥" if you saw this setup before the drop!
📌 Bookmark this – confluence stacking is how you win consistently
👊 Share this with someone still buying the top 📈🙃

BTCUSD UPDATE : 27- 5 - 2025This chart shows a 1-hour time frame for Bitcoin (BTC/USD) on Bitstamp, with technical analysis indicating a potential bearish move. Here’s a breakdown of the chart:
Price Range: The chart highlights a trading range between approximately $102,714 (support) and $112,053 (resistance), marked with yellow zones.
Current Price: BTC is trading around $109,026.
Bearish Signal: A blue arrow points downward, suggesting an anticipated drop in price.
Pattern Suggestion: It looks like a potential double top or lower high is forming, signaling weakening bullish momentum.
Target Zone: The arrow points towards the support zone around $102,714, implying that the chartist expects BTC to fall to that level.
This type of analysis is often used for short-term trades and may involve setting stop-losses near $112,053 and profit targets near $102,714. Let me know if you'd like help interpreting this pattern further or backtesting the setup.

Short-Term BTC Scalping Opportunity⚡Say less
💥Setup and forget
💥the position is off if price hits 111,959 first.
💥leverage maybe used according to your risk management

BTC weekly Weekly log chart on BTC looks ready for price discovery following bullish consolidation. If this setup plays out like the prior major breakouts, we're gonna see some new ATHs soon.


GBPAUD…being the best is a mindset!!Good day traders, I am back again with another great setup and again another opportunity to learn something new.
On the daily TF on GBpAUD we still in a bearish structure and if we use the 2022 model, we had a structure shift lower and now that price is retesting the OTE entry levels we can now expect price to shoot lower, before you asked about the recent FVG on 4H TF. That newly formed BISI is that candle that created the BPR and from what I’ve learned is that price normally shoots past BPR’s.
My poll of liquidity is resting below(weekly), that Ray line makes weekly represents previous week’s low which we want to see the market get to. Just on top of that ray line we have a FVG that price left open, we also wanna see price fill that FVG fully.

$BTC to $120K?Bitcoin is still moving strongly inside the ascending channel, respecting both support and midline zones.
After bouncing from the lower boundary and holding above key horizontal support at $104.8K, BTC is showing signs of strength again.
With the trend intact and momentum building, a breakout toward the $116k 120k supply zone looks likely in the coming days.
Bulls remain in control as long as price holds above the mid channel and key FVG (Fair Value Gap) areas.
Watch the channel closely for confirmation.
DYRO, NFA

BTCUSD: Urgently needs to break above this trendline!Bitcoin is bullish on its 1D technical outlook (RSI = 65.624, MACD = 4011.100, ADX = 25.476) but not overbought anymore as the aggressive weekly rallies since the 1W MA50 rebound have been decelerated. The next heavy obstacle is the HH trendline that runs on top of the January 20th 2025 and December 16th 2024 Highs and got hit last week. So far the price hasn't crossed above it but it needs to urgently in order to avoid a rejection with snowball effects.
The last time Bitcoin faced a similar HH trendline Resistance was on the October 23rd 2023 1W candle and it succesfully smashed through it, completing a +79.23% rise before consolidating again. If it breaks again above it, we expect the same minimum rally, which gives us a TP = 133,500.
## If you like our free content follow our profile to get more daily ideas. ##
## Comments and likes are greatly appreciated. ##

Bitcoin - This time different ?In 2021-22 bitcoin formed a higher high on weekly chart and then bear run of 2022 started, if we look at the bitcoin current chart the same pattern being formed.
Do you think bitcoin will form the similar pattern ? In my opinion it is highly unlikely that bitcoin will see similar pattern, in 2022 the second push was due to overall market euphoria which pushed the price to new high even though bear market was already on (Bitcoin hit new ATH after crashing 55% which is unusual)
If we look at the current pattern bitcoin had -30% crash, which is normal between bull runs, so its highly unlikely that bitcoin will similar fate as 2021.
Follow Our TradingView Account for More Technical Analysis Updates, | Like, Share and Comment Your thoughts.
Cheers
GreenCrypto

Bitcoin : Impulse up or Flat Trap!?If you find this information inspiring/helpful, please consider a boost and follow! Any questions or comments, please leave a comment!
BTC has staged a solid move off the May 25 low — but the context matters. We’re facing two distinct, high-stakes scenarios here: one bullish, one bearish. What happens next hinges on whether the May 25 rally is the start of a new impulse or the final leg (C wave) of an expanded flat off the all-time high.
Structure Breakdown
Bearish View: We’re completing a textbook expanded flat from the ATH:
A wave started May 23
B wave pushed to a lower low.
C wave began May 25 and is likely wrapping up now
If valid, this sets the stage for a powerful Wave 3 down.
Bullish View: The May 25 low marked the end of a corrective phase:
Rally from that low is an impulsive Wave 1
A pullback to the 108k golden zone would represent Wave 2
Wave 3/C up could follow from that base
What to Watch
The area around 108,000–107,100 is a magnet. If price retraces into this zone with a corrective look and holds, bulls could be in control. But if we roll over hard from here, it supports the expanded flat thesis — and a much deeper move likely follows.
Outlook
This is a moment for sharpen focus. The chart structure is clean, but the outcome isn't binary until we see what kind of retrace (if any) forms.
Watch 108k like a hawk. If bulls defend it, there’s room to talk new highs. If we break impulsively from here, expect acceleration lower — fast.
Trade safe, trade smart, trade clarity.

BTC in Bullish Channel – Another HH Coming ?Bitcoin continues to respect this ascending channel with clear Higher Highs (HH) and Higher Lows (HL).
Every breakout has followed consolidation and pullback patterns. RSI is neutral a breakout above $110K+ could confirm the next HH.
Watching for a move toward the top of the channel... or a deeper HL retest?
What's your take?

Bitcoin - Approaching the all time high!Bitcoin - CRYPTO:BTCUSD - will break out again:
(click chart above to see the in depth analysis👆🏻)
It has been quite some time since we saw such a strong move on Bitcoin. But finally - not totally unexpected to be honest - Bitcoin is following its destiny and about to create another new all time high. Patience is key and strategy, risk and mindset will help you master the volatility.
Levels to watch: $100.000
Keep your long term vision!
Philip (BasicTrading)
